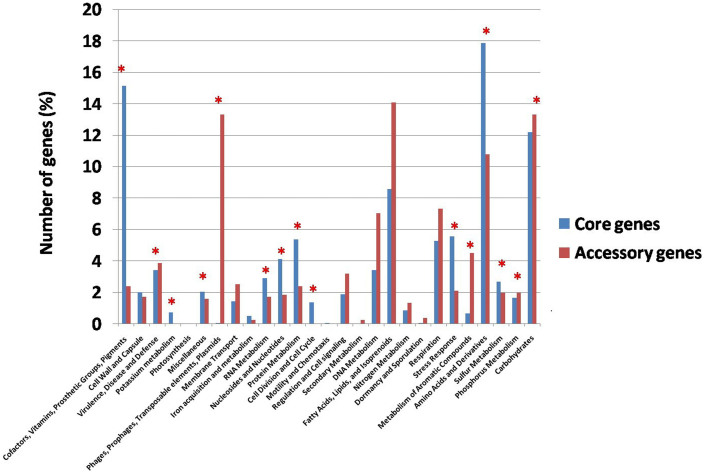
Figure 2. Functional classification of the core and accessory genes.
Distribution of core and accessory genes in the functional subsystem classified using RAST. Categories that show significant difference of distribution between the core and accessory genes are marked with a red asterisk on the top of the bar (p value after Bonferroni correction = 0.05).

