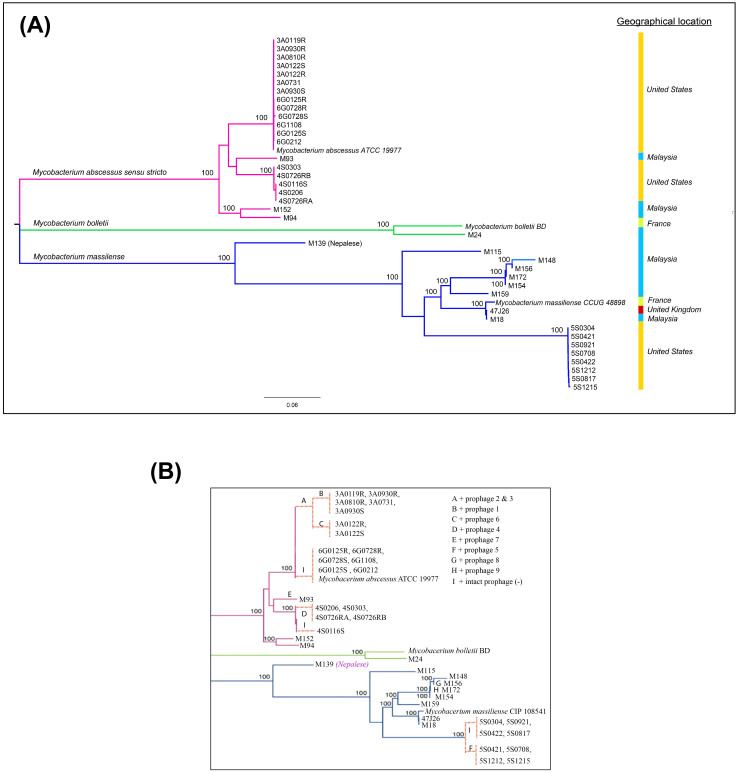
Figure 5. Phylogenetic relationship of 40 Ma strains and intact prophage distribution.
(A) The phylogenetic tree was generated using core genome SNPs and the maximum likelihood method. Bootstrap numbers were generated in 1,000 runs. Nodes with bootstrap support values of 100 are indicated. (B) Mapping of putative intact prophages onto the SNP-based phylogenetic tree. The intact prophage distribution further subdivides the clade into branches. “I” means no intact prophage.

