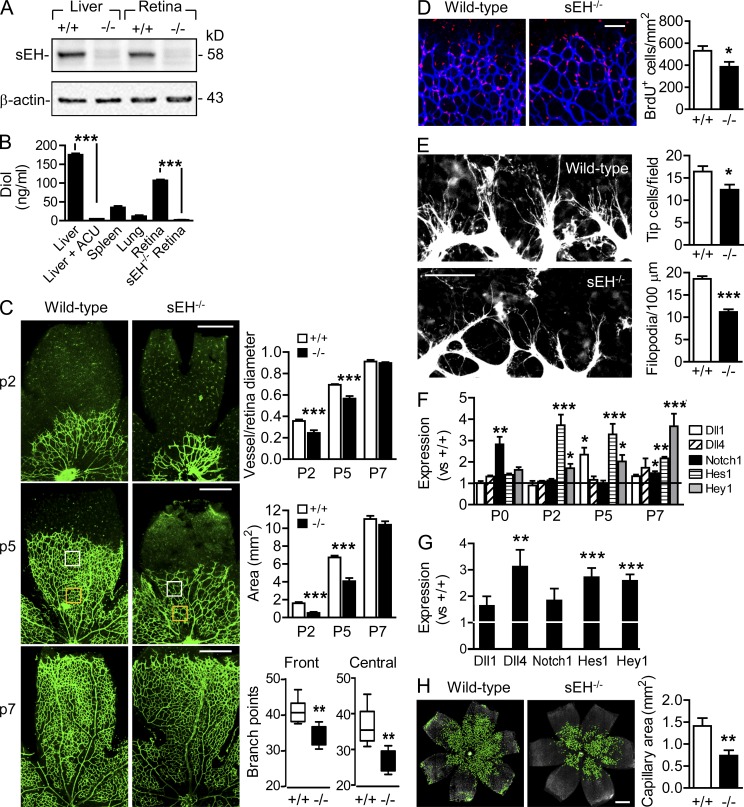
Figure 1.
Delayed angiogenesis in sEH−/− retinas. (A) Expression of the sEH in liver and retina from wild-type (+/+) and sEH−/− (−/−) mice was analyzed by Western blotting. (B) sEH activity in liver, spleen, lung, and retinas from wild-type and retinas from sEH−/− mice as assessed by monitoring the generation of 14,15-DHET from 14,15-EET. Liver extracts were incubated with 10 µmol/liter of the sEH inhibitor 1-adamantyl-3-cyclohexylurea (ACU) for 20 min. n = 4–6 animals per group. (C) Isolectin B4 staining was assessed in whole mounts of the retinal vasculature in wild-type (+/+) and sEH−/− (−/−) mice by confocal microscopy on P2, P5, and P7. The front and central areas analyzed on P5 retinas are indicated by white and orange boxes, respectively. Bars, 500 µm. The bar graphs summarize data from 1–3 animals per group in each experiment and experiments were independently performed 3 times. (D) BrdU (red) and Isolectin B4 (blue) levels in wild-type and sEH−/− retinas (P5) were assessed by confocal microscopy. Bar, 100 µm. n = 2 animals per group in each experiment and experiments were independently performed 3 times. (E) High magnification images and quantification of Isolectin B4–stained tip cells and filopodia (P5). Bar, 50 µm. n = 10 animals per group. (F) Notch pathway gene expression in sEH−/− retinas (P5) relative to wild-type (+/+) was assessed by RT-qPCR. Each sample was a pool of 3 retinas, and the assay was performed on 4 independent samples. (G) Notch pathway gene expression was assessed by RT-qPCR in isolated retinal endothelial cells from sEH−/− mice at P5 relative to wild-type (+/+). Each sample was a pool of 6 retinas, and the assay was performed on 4 independent samples. (H) Isolectin B4 staining of the deeper capillary vessel network in wild-type and sEH−/− P9 retinas was assessed by confocal microscopy. Bar, 500 µm. n = 9 for wild-type and n = 11 for sEH−/− mice from a total of 5 different experiments. Error bars represent SEM. *, P < 0.05; **, P < 0.01; ***, P < 0.001 versus wild-type.

