Figure 4.
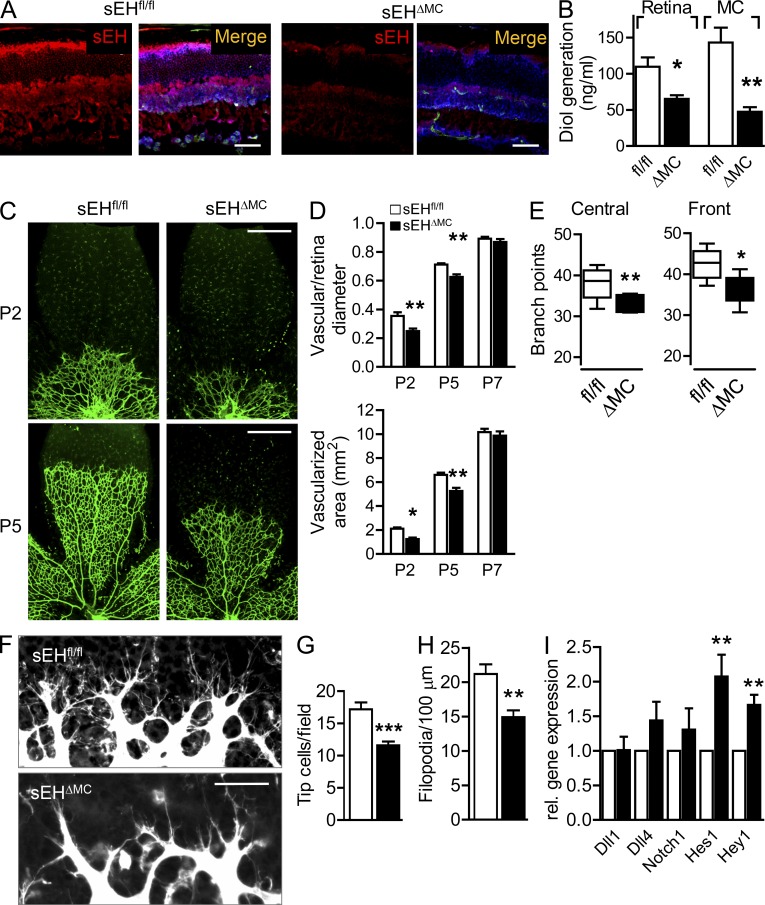
Angiogenesis in Müller cell–specific sEH knockout mice. (A) sEH expression (red) in cryosections from sEHfl/fl and sEHΔMC littermates. Bars, 50 µm. Endothelial cells were identified using Isolectin B4 (green), and Müller cells by GS (blue) using confocal microscopy. Similar observations were made in 4 additional experiments. (B) sEH activity was assessed by LC-MS/MS in fresh retinas and cultured Müller cells (MCs) from sEHfl/fl and sEHΔMC littermates. Each sample was a pool of 3 retinas, and the analysis was performed on 4 independent samples per genotype (graph shows pooled data from the four analyses). (C) Isolectin B4 staining of retinal whole mounts of P2 and P5 retinas from sEHfl/fl and sEHΔMC mice. Bars, 500 µm. (D and E) Quantification of vessel radial expansion (D), vascularized area, and vessel branch points (E) in sEHfl/fl and sEHΔMC mice at P5 based in data in C. n = 5–7 total mice from 3–4 different experiments. (F) Isolectin B4–stained tip cells and filopodia at P5 assessed by confocal microscopy. Bar, 50 µm. (G and H) Quantification of tip cells (G) and filopodia numbers (H) in P5 retinas based on data in F. n = 6 total mice from 3–4 different experiments. (I) Notch pathway gene expression in retinas from sEHΔMC relative to sEHfl/fl mice was assessed by RT-qPCR. Each sample was a pool of 3 retinas, and the assay was performed on 4 independent samples per genotype. Error bars represent SEM. *, P < 0.05; **, P < 0.01; ***, P < 0.001 versus sEHfl/fl.

