Figure 5.
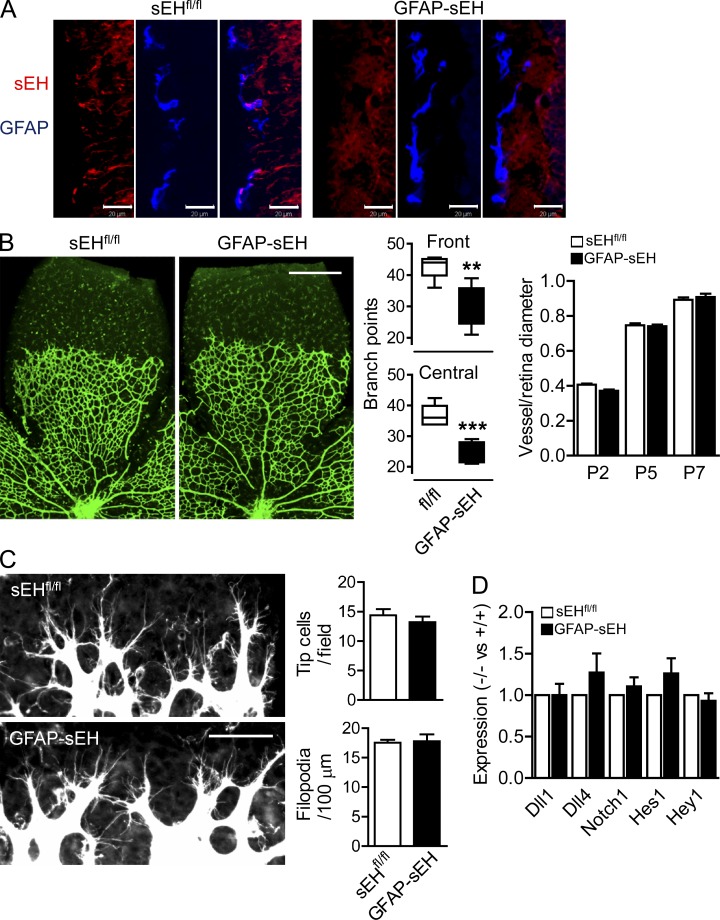
Angiogenesis in astrocyte-specific sEH knockout mice. (A) sEH and GFAP expression in sEHfl/fl and astrocyte-specific sEH knockout (GFAP-sEH) littermates was assessed by confocal microscopy. Bars, 20 µm. Similar observations were made in 4 additional experiments. (B) Isolectin B4 staining of retinal whole mounts from sEHfl/fl and GFAP-sEH mice at P5 was assessed and quantified by confocal microscopy. Bar, 500 µm. n = 5–7 total mice from 3–4 different experiments. (C) Isolectin B4–stained tip cells and filopodia in retinas from sEHfl/fl and GFAP-sEH mice at P5 was assessed and quantified by confocal microscopy. Bar, 50 µm. n = 6 total mice from 3–4 different experiments. (D) Notch pathway gene expression in sEHfl/fl and GFAP-sEH P5 retinas was assessed by RT-qPCR. Each sample was a pool of 3 retinas, and the analysis was performed on 4 independent samples per genotype. Error bars represent SEM. **, P < 0.01; ***, P < 0.001 versus sEHfl/fl.

