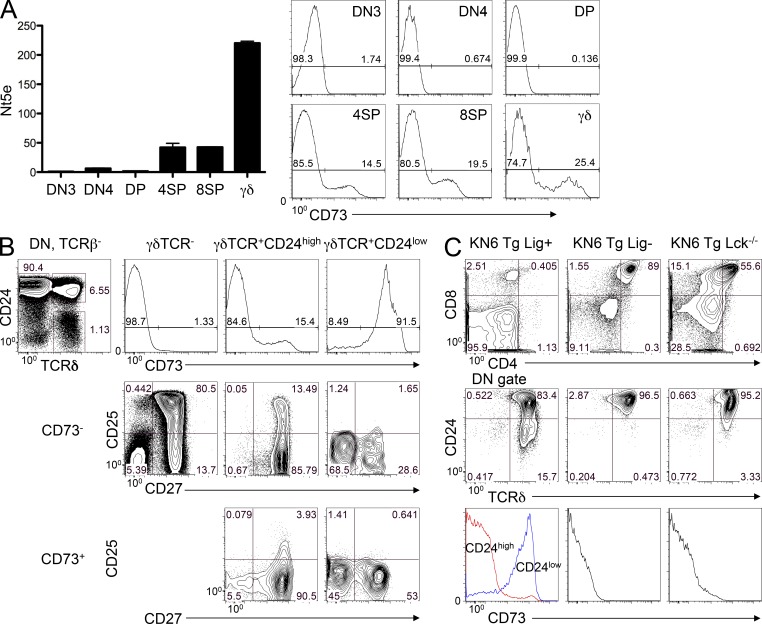
Figure 2.
CD73 is inducible by ligand engagement and is highly expressed in γδ lineage T cells. (A) The indicated thymocyte populations were isolated by cell sorting: DN3, TCR-β−TCR-γδ−CD25+CD44−; DN4, TCR-β−TCR-γδ−CD25−CD44−; DP, CD4+CD8+; 4SP, CD4+; 8SP, CD8+; and γδ, CD4−CD8−γδTCR+. Expression of CD73 mRNA was quantified by real-time PCR and levels were normalized to β-actin. Graphed values indicate mean ± SD. Surface expression of CD73 on the sorted populations was measured by flow cytometry to determine the frequency of CD73− and CD73+ cells. Gate frequencies of the CD73− and CD73+ populations are listed on the histograms. (B) CD73 expression was measured by flow cytometry on the indicated γδTCR-expressing thymocyte populations from adult mice. The left panel shows the gating strategy and percentages for each population, with the gate frequencies indicated on the histograms. (C) KN6 γδTCR Tg thymocytes were exposed in vivo to strong TCR signals (T-10d; KN6 Tg Lig+, KN6 Tg Rag2−/−) or to diminished TCR signaling, produced either by eliminating ligand (KN6 Tg Lig−, KN6 Tg Rag2−/−B2m−/−) or by ablation of the p56lck tyrosine kinase (KN6 Tg Rag2−/−Lck−/−). The numbers shown indicate the percentage of cells within gated quadrants and data are representative of results from analysis of at least five mice of each genotype from at least three independent experiments.

