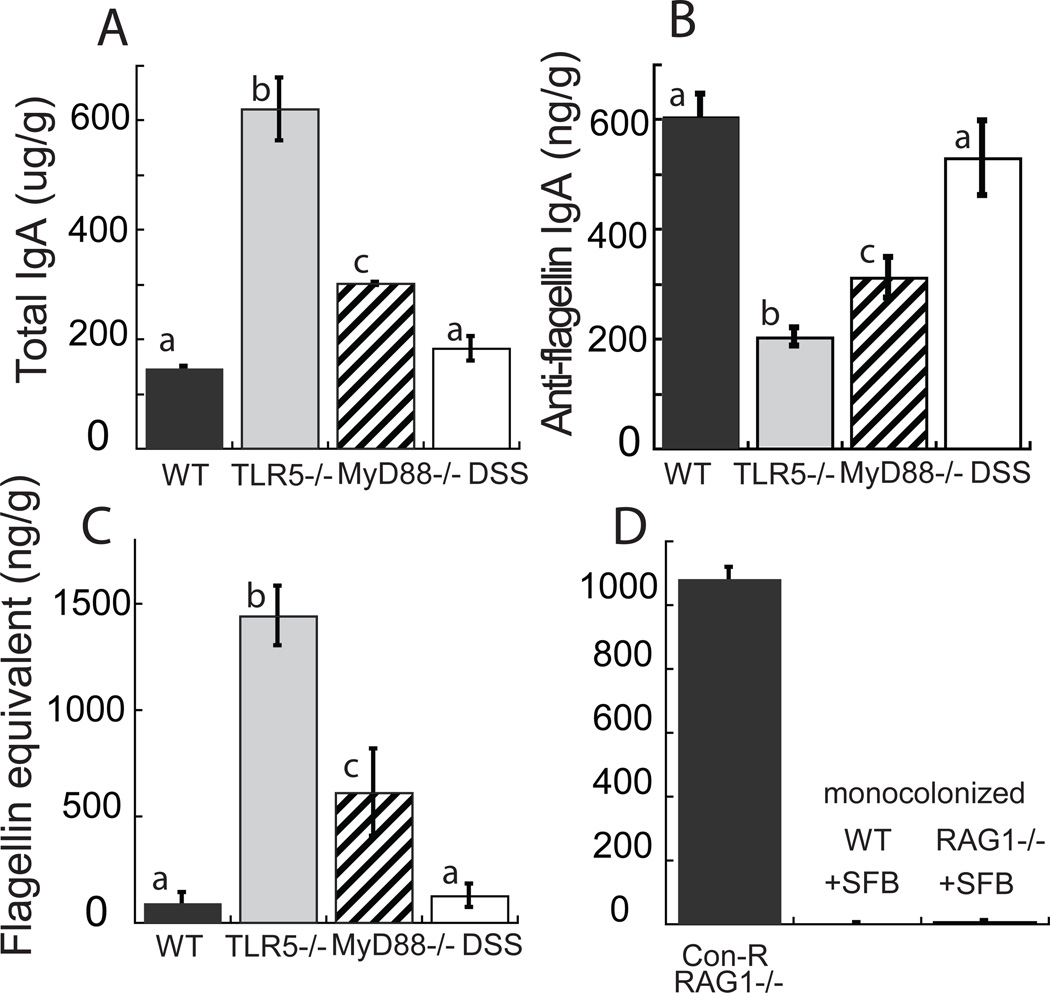
Figure 1. Gut flagellin load is inversely proportional to anti-flagellin IgA levels.
(A) Total IgA levels, (B) anti-flagellin IgA levels (anti-flagellin IgG equivalents), and (C) flagellin (Salmonella Typhimurium flagellin equivalents) load for WT, TLR5−/−, MyD88−/−, and DSS-treated WT B57Bl/6 mice. (D) Flagellin amounts for conventionally raised RAG1−/− mice (Con-R), and WT and RAG1−/− mice monocolonized with SFB (+SFB). The y-axis label for C applies to D also. Columns represent means ± s.e.m. N= 8 mouse per group; lower-case letters next to the bars indicate significance: bars with different letters indicate significantly different means at P < 0.05 using a two-tailed t-test corrected for multiple comparisons. Relates to Figure S1.

