
Figure 3.
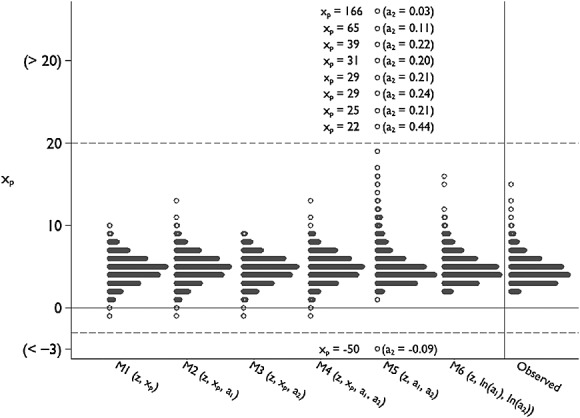
Dotplot of imputed cholesterol ratio for single (typical) imputed datasets in EPIC-Norfolk under models M1–M6. Imputed values of xp < 3 or xp > 20 are not plotted but represented according to rank; imputed values of (xp,a1) are listed.
Official websites use .gov
A
.gov website belongs to an official
government organization in the United States.
Secure .gov websites use HTTPS
A lock (
) or https:// means you've safely
connected to the .gov website. Share sensitive
information only on official, secure websites.
Dotplot of imputed cholesterol ratio for single (typical) imputed datasets in EPIC-Norfolk under models M1–M6. Imputed values of xp < 3 or xp > 20 are not plotted but represented according to rank; imputed values of (xp,a1) are listed.