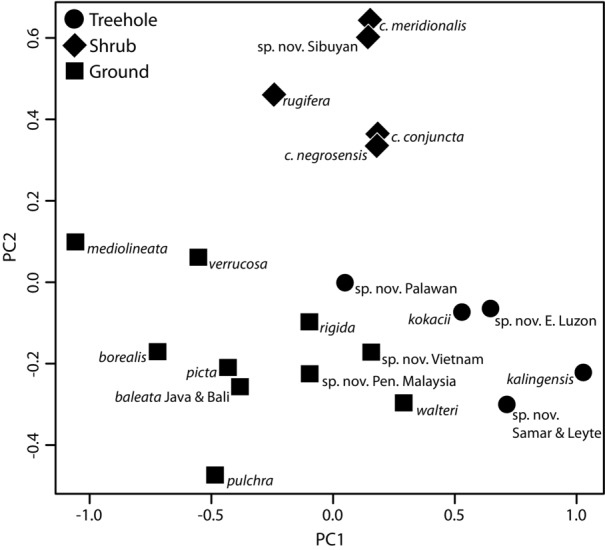
Figure 2.

Relationship between morphological variation and ecotype categories in Kaloula. Species scores for the first two principal components (PC1 and PC2) are plotted; see Table4 for loadings and percent variance explained.

Relationship between morphological variation and ecotype categories in Kaloula. Species scores for the first two principal components (PC1 and PC2) are plotted; see Table4 for loadings and percent variance explained.