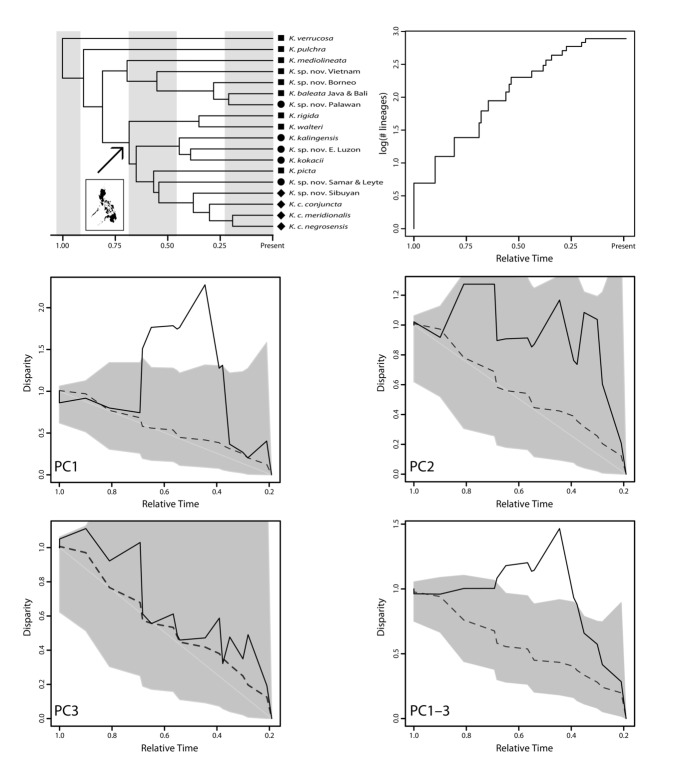
Figure 3.
Disparification through relative time in Kaloula. Top-left panel shows MCCT chronogram (with shapes corresponding to ecotypes of Fig. 2) and top-right panel shows lineage-through-time plot. Middle and bottom panels show disparity-through-time (DTT) plots for PC1phylo, PC2phylo, PC3phylo, and all three axes together (PC1–3phylo). Solid black lines on DTT plots is observed disparity based on MCCT, gray lines and polygons represent median and 95% confidence intervals from BM simulations, respectively.

