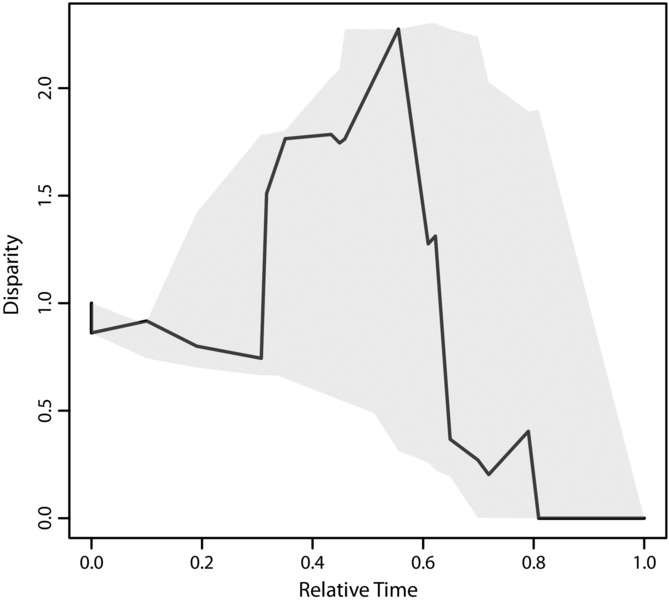
Figure 4.

Uncertainty in disparification through time in Kaloula for PC1phylo. Solid black line on DTT plot is observed disparity based on MCCT; gray polygons represent 95% confidence interval for observed disparity based on post–burn-in trees from BEAST analysis.
