
Figure 5.
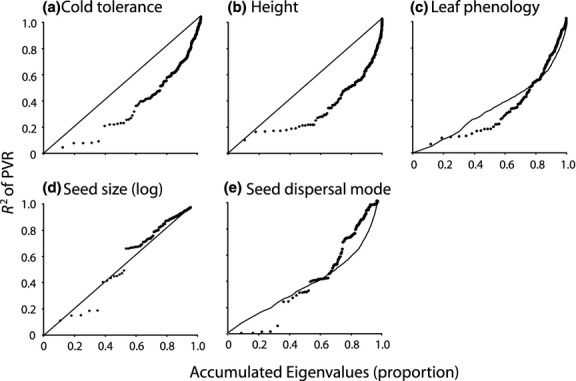
Phylogenetic signal representation curves (black dots) for (a) cold tolerance, (b) height, (c) leaf phenology, (d) seed size and (e) seed dispersal mode of North American tree species. The diagonal in the continuous traits (a,b,d) is the relationship expected under a Brownian motion model of evolution. The Brownian expectations for the discrete traits (c,e) are average R2 values derived from 250 simulations.