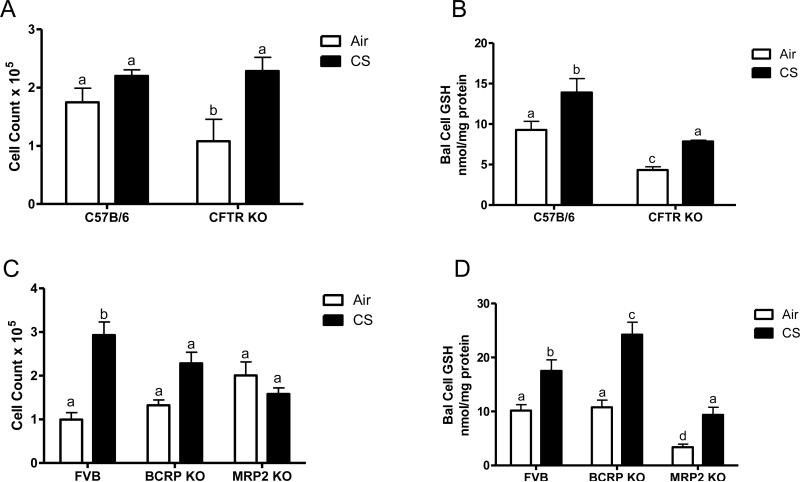
Figure 4.
Analysis of BAL cell number and GSH content in the CFTR, BCRP, and MRP2 KO mice. The cell count was analyzed in the CFTR (A), BCRP and MRP2 (C) and the respective controls from the cells recovered during bronchalveolar lavage. Furthermore, the BAL cell GSH was also analyzed in the same BAL cells (B and D). Data represented as mean ± SEM, different letters denote significant differences (p < 0.05) between groups.

