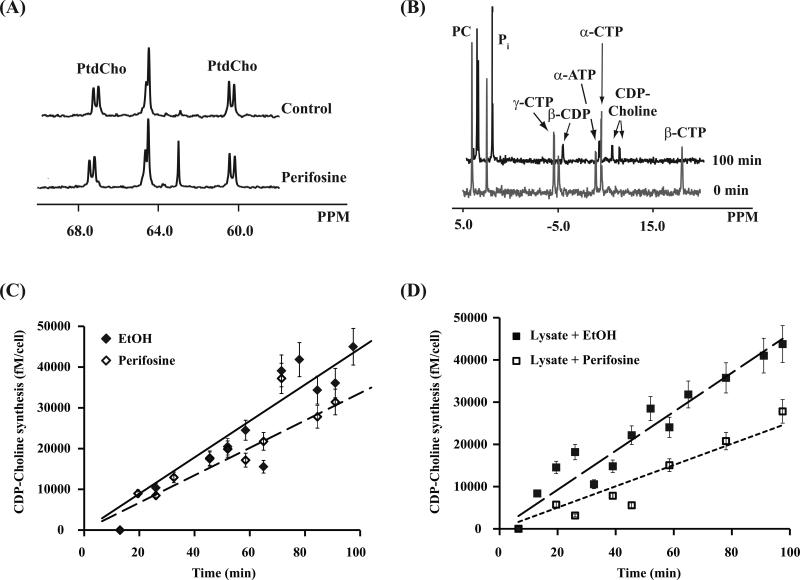
Figure 4. Effect of perifosine on CT.
(A) Representative 13C spectra of lipid fraction showing the effect of treatment on de novo synthesis of PtdCho. (B) 31P spectra of MCF-7 cell lysate at the beginning and the end of CT activity assay measurement. The concentration of reaction product, CDP-Choline, was plotted against time, and the synthesis rate was determined from the slope of the straight-line fit. (C) Representative plot of CDP-Choline biosynthesis versus time in control cell lysate ( ◆ ) and perifosine-treated cell lysate ( ◇ ). (D) Representative plot of CDP-Choline biosynthesis versus time from extracted cell lysate plus EtOH ( ■ ) and extracted cell lysate plus 30 μM perifosine ( □ ).

