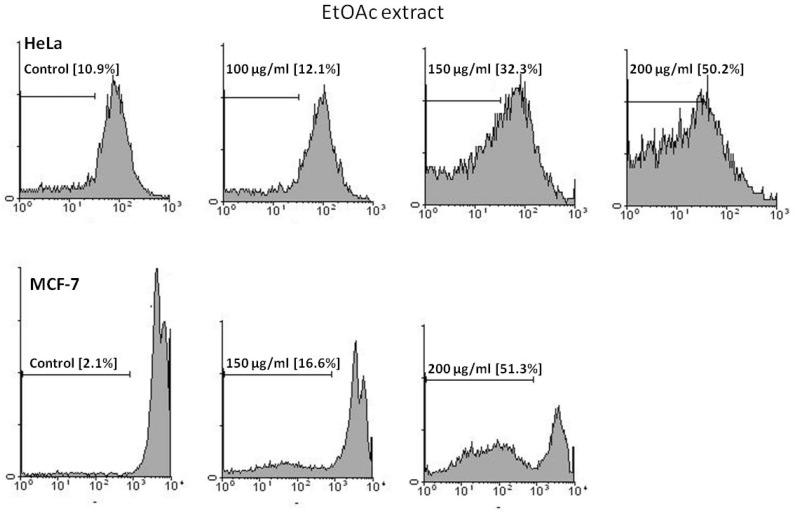
Figure 3.
Flow cytometry histograms of apoptosis assays by PI method in HeLa and MCF-7 cells. Cells were treated with 100, 150 and 200 μg/mL in HeLa and 150 and 200 μg/mL in MCF-7 cells by EtOAc extract for 48 h. Sub-G1 peak as an indicative of apoptotic cells, was induced in EtOAc extract-treated but not in control cells indicating involvement of an apoptosis in EtOAc extract -induced cell death

