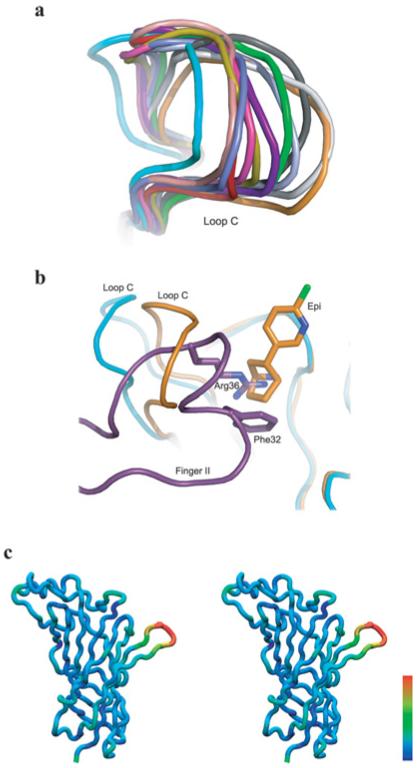
Figure 3. Conformations of α7/AChBP without and with bound ligands.
(a) Comparison of loop C from α7/AChBP with bound α–btx (cyan), bound epibatidine (orange) and without bound ligands (different colour for each conformation; PDB code 3SQ9). (b)Super imposition of the α7/AChBP chimaera(cyan) with bound α-btx (purple) and the α7/AChBP chimaera (orange) with bound epibatidine (PDB code 3SQ6) showing the spatial relationship between Arg36 of α-btx and epibatidine. (c) Stereo view of a subunit from the complex between α7/AChBP and α-btx in which residue RMSDs between the α-btx and epibatidine conformations are colour coded on the protein backbone; the colour scale is linear with RMSD, with the range from blue to red spanning RMSDs from 0.53 to 6.05Å.

