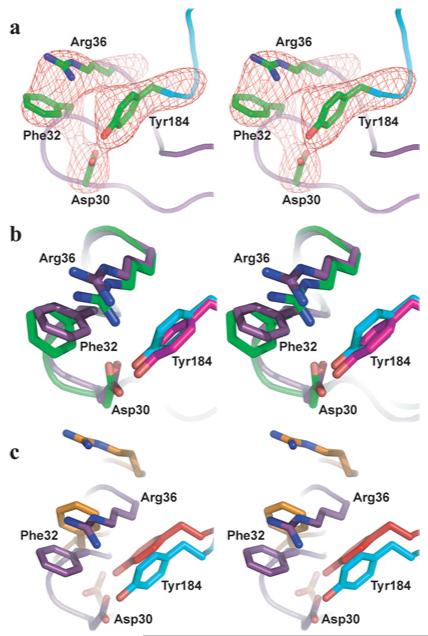
Figure 5. The interaction tetrad Tyr184, Arg36, Phe32 and Asp30.
(a) Electron density of the complex between α-btx and α7/AChBP in the region of the tetrad. (b) Superimposition of the tetrad in the complex between α-btx and α7/AChBP (Arg36, Phe32 and Asp30 are purple; Tyr184 is cyan) with that of the complex between α-btx and α1 (Arg36, Phe32 and Asp30 are green; Tyr184 is magenta). (c) Superimposition of the tetrad from the complex between α-btx and α7/AChBP (colours as in b) with that of the complex between α-ctx and AChBP (residues equivalent to Arg36, Phe32 and Asp30 are orange; residue equivalent to Tyr184 is red).

