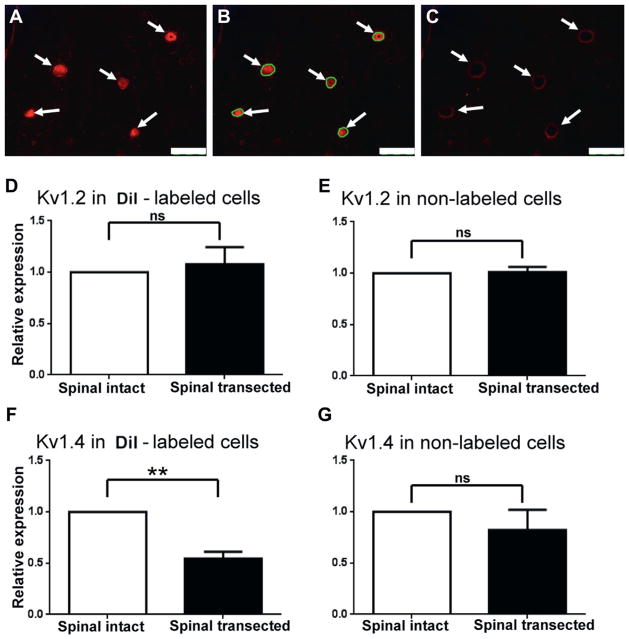
Figure 5.
Kv α-subunit mRNA expression after spinal cord transection. A to C, photomicrographs show single L6 DRG section during laser capture microdissection of DiI labeled bladder afferent neurons. Arrows indicate neurons positively stained with DiI. Scale bars represent 100 μm. A, before microdissection. B, before microdissection. Green circles indicate laser captured areas. C, after microdissection. D to G, mean ± SEM levels in 30 neurons from each of 5 spinal intact and 5 spinal transected rats. ns, not significant. Asterisks indicate p <0.01 vs spinal intact.

