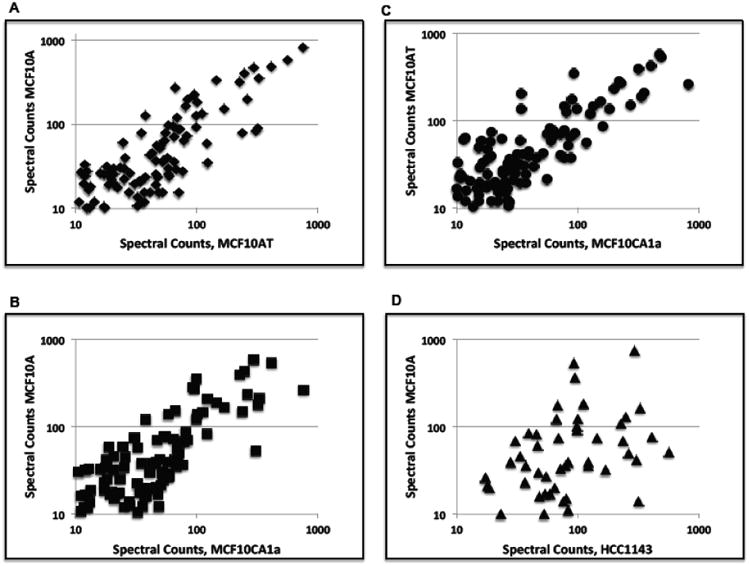
Figure 1.

Comparisons of glycoprotein profiles of breast cancer cell lines. Glycoprotein profiles from MCF10A and its derivatives MCF10AT and MCF10CA1a show a greater correlation than the correlation between MCF10A and the breast cancer cell line HCC1143. Plots are log10 spectral counts. (A) MCF10A vs. MCF10AT, R2 = 0.810 ; (B) MCF10A vs. MCF10CA1a, R2 = 0.583; (C) MCF10AT vs. MCF10CA1a, R2 = 0.667; (D) MCF10A vs. HCC1143, R2 = 0.097.
