
Figure 2.
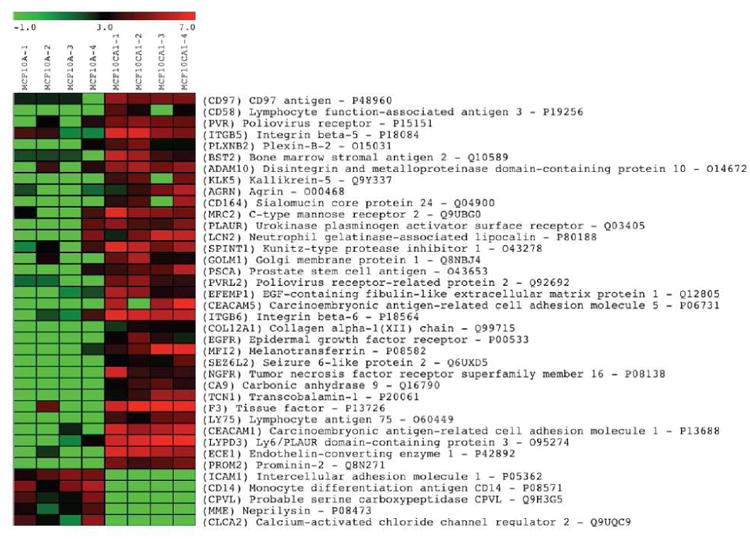
Differentially expressed glycoproteins comparing glycoprotein profiles of benign (MCF10A) and malignant (MCF10CA1a) breast cell lines. MCF10A-1 through MCF10A-4, and MCF10CA1a-1 through MCF10CA1a-4 represent four glycoprotein profiles from four biological replicates for each cell line. The bar at the top of the figure shows the range of expression levels (log2).