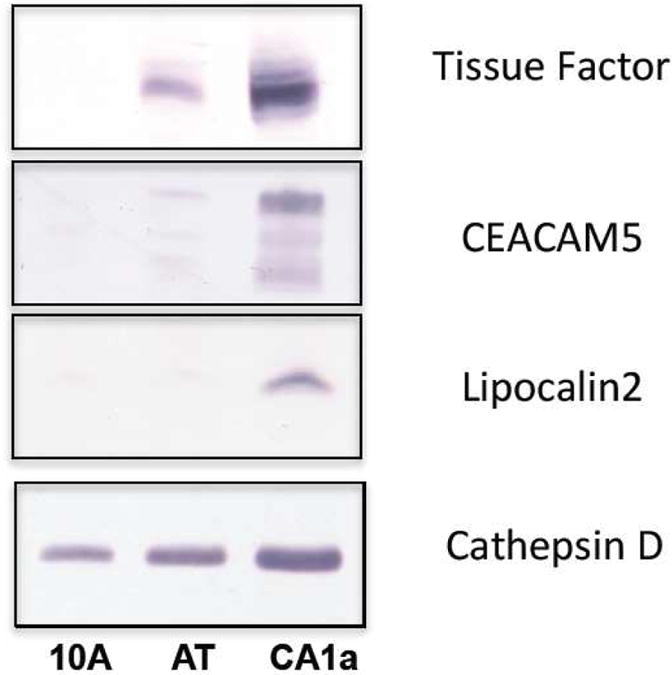
Figure 3.

Expression levels of tissue factor, CEACAM5 and lipocalin2 vary among the MCF10A family of cell lines. Cathepsin D was expressed at significant levels in all three lines and is shown as a positive control for sample loading. (10A = MCF10A, AT = MCF10AT and CA1a = MCF10CA1a cell lysates).
