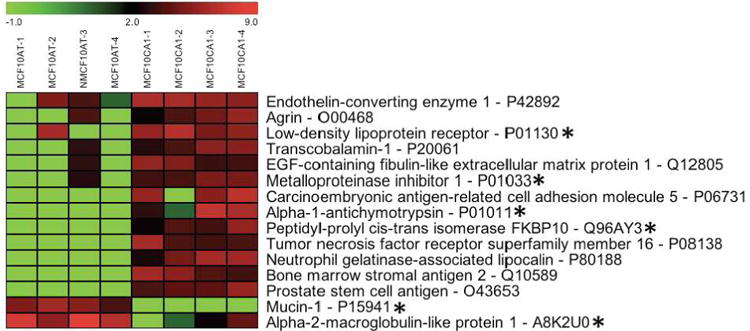
Figure 4.

Differentially expressed glycoproteins comparing glycoprotein profiles of premalignant (MCF10AT) and malignant (MCF10CA1a) breast cell lines. MCF10AT-1 through MCF10AT-4, and MCF10CA1a-1 through MCF10CA1a-4 represent four glycoprotein profiles from four biological replicates for the premalignant and malignant cell lines, respectively. The gradated bar at the top of the figure shows the range of expression levels (log2). Glycoproteins labeled with an asterisk uniquely change in the transition from premalignancy to malignancy.
