
Figure 5.
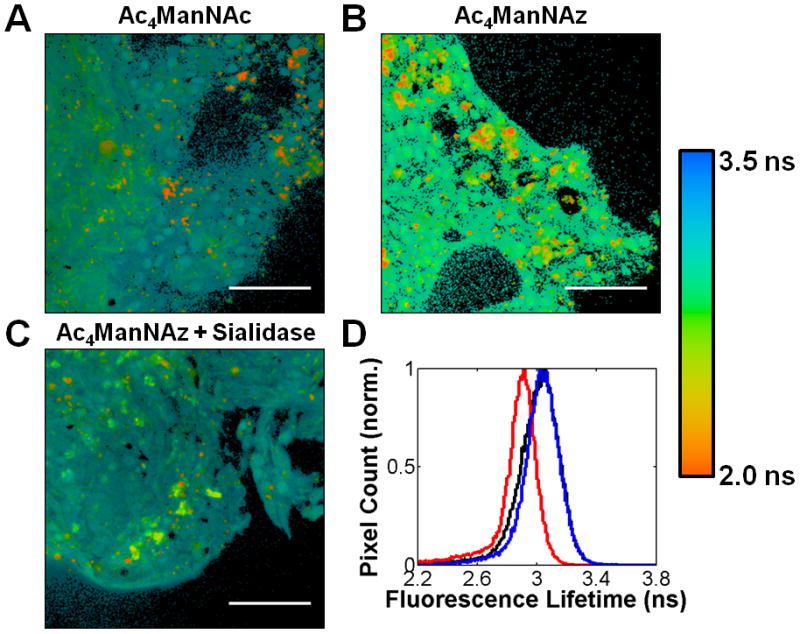
FLIM images and lifetime histogram of grade 3–4 human prostate adenocarinoma tissue slices. Tissue slices were incubated with either Ac4ManNAc (A), Ac4ManNAz (B), or Ac4ManNAz and sialidase (C) then treated with DIBAC-647 and Fab-594. FLIM images are the heat maps of τ values determined per pixel, see accompanying legend (right). (D) Histogram of τ values for tissues treated with either Ac4ManNAc (black line), Ac4ManNAz and sialidase (blue line), or Ac4ManNAz (red) and then incubated with DIBAC-647 and Fab-594. Scale bar: 50 μm.