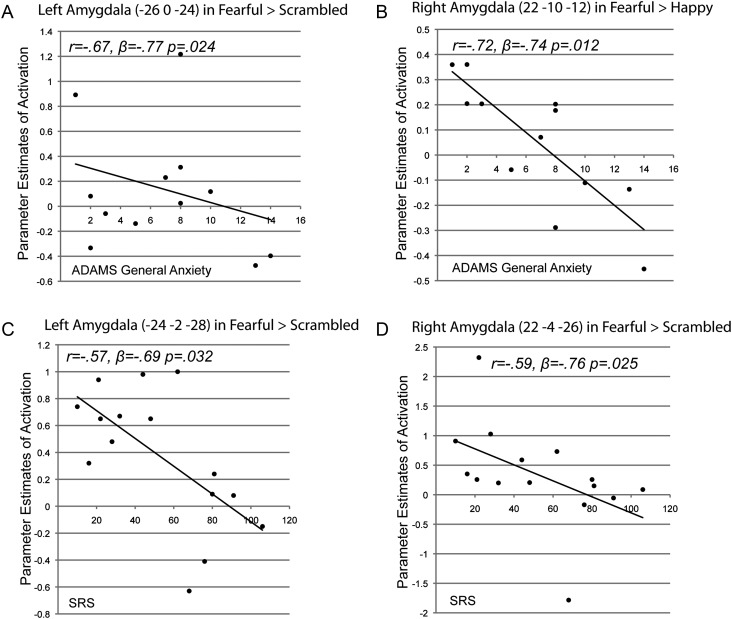
Figure 4.
(A) A scatter plot showing a negative correlation between ADAMS general anxiety scores and left amygdala activation in the FX group in the Fearful > Scrambled contrast. (B) A scatter plot showing a negative correlation between ADAMS general anxiety scores and right amygdala activation in the FX group in the Fearful > Happy contrast. (C) A scatter plot showing a negative correlation between SRS scores and right amygdala activation in the FX group in the Fearful > Scrambled contrast. (D) A scatter plot showing a negative correlation between SRS scores and left amygdala activation in the FX group in the Fearful > Scrambled contrast.

