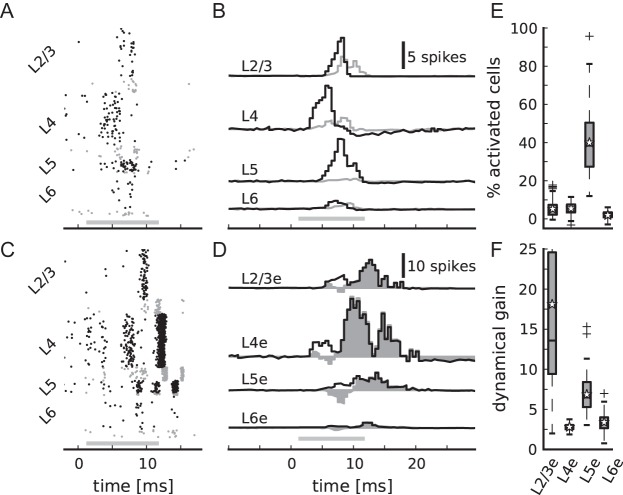
Figure 10.
Response to transient thalamic input. Thalamic firing rates increase step-like by 15 Hz for a duration of 10 ms; 0 ms corresponds to the onset of transient input, gray bars show the arrival of thalamic spikes at cortical neurons taking the mean delay (for simplicity the same as within the network, 1.5 ms) into account. (A) Cell-type specific spiking activity of the network with i-specific projections. Markers as in Figure 6A. (B) Corresponding cell-type specific population spike counts averaged over 100 instantiations of network and input (excitatory populations in black, inhibitory in gray). Spike counts are calculated with a bin width of 0.5 ms with the number of recorded neurons L3e: 500, L3i: 141, L4e: 529, L4i: 132, L5e: 117, L5i: 25, L6e: 347, L6i: 71 (numbers correspond to relative population sizes). (C) Spiking activity of a control network without i-specific projections (target specificity of candidate projections of +0.4) stabilized by an asymmetry of excitatory synaptic strengths of 0.095. (D) Corresponding cell-type specific population spike counts of excitatory populations averaged over 100 instantiations. Filled area shows the difference of the data in D and B. (E) Average percentage of cells in the excitatory populations that are activated by thalamic stimulation in relation to the ongoing activity (according to the data in B). (F) Dynamical gain, defined as the firing rate during the stimulus presentation divided by the spontaneous firing rate, of excitatory populations (according to the data in B).

