
Figure 12.
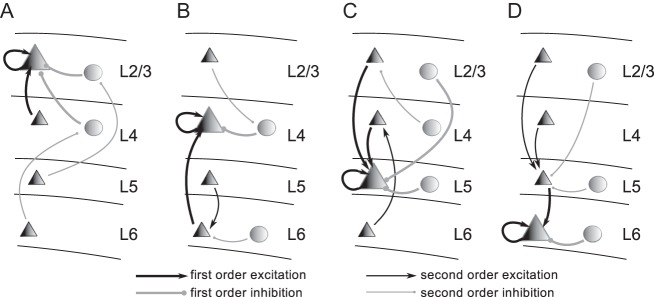
Input structure for the excitatory cell types L2/3e (A), L4e (B), L5e (C), and L6e (D) (large triangles). The illustrations show the strongest pathways, that is, only connection probabilities >0.04 are considered, of direct (first order, thick arrows) and indirect (second order, thin arrows) excitation (black) and inhibition (gray) of a given population (see Supplementary Material for further details). Triangles represent excitatory and circles inhibitory populations.