Figure 2.
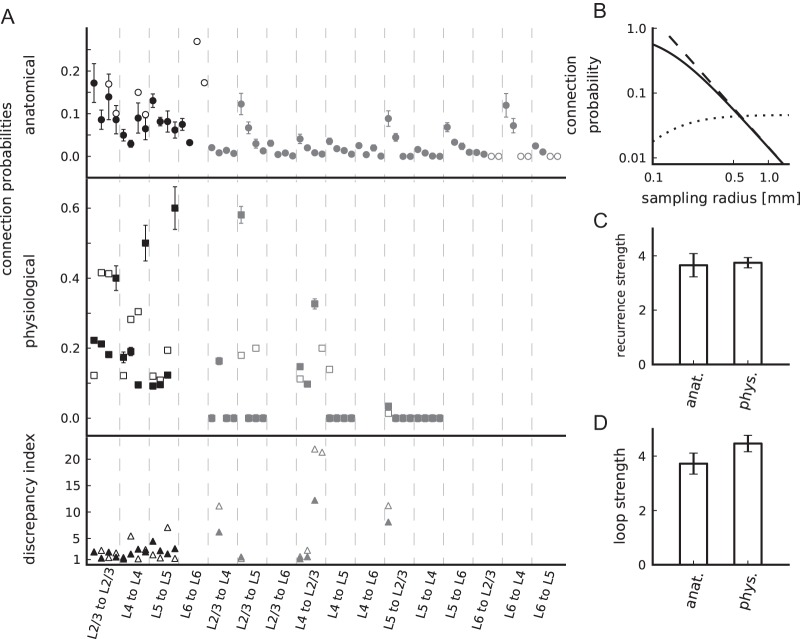
Properties of connectivity maps. (A) Connection probabilities according to the anatomical (top panel, circles) and physiological connectivity maps (center panel, squares) and corresponding discrepancy indices (bottom panel, triangles). Both raw (closed markers) and modified (open markers) maps are shown (also provided in Supplementary Table 1). The data are horizontally arranged according to their classification as within-layer (black) and interlayer (gray) connections. For a given pair of pre- and postsynaptic layer, the data are arranged from left to right according to connection types: Excitatory to excitatory, excitatory to inhibitory, inhibitory to excitatory, and inhibitory to inhibitory. L5i to L5e/i outside of the displayed range, see Supplementary Table 1. Error bars are minimal statistical errors (Supplementary Material). (B) Dependence on sampling radius of the anatomical connection probability (solid: eq. (1), dashed: eq. (2)) and the product of connection probability and area (dotted) in double-logarithmic representation. (C) Anatomical and physiological recurrence strength. (D) Anatomical and physiological loop strength. Error bars in C and D are based on the minimal statistical error estimates of connection probabilities using error propagation.

