
Figure 3.
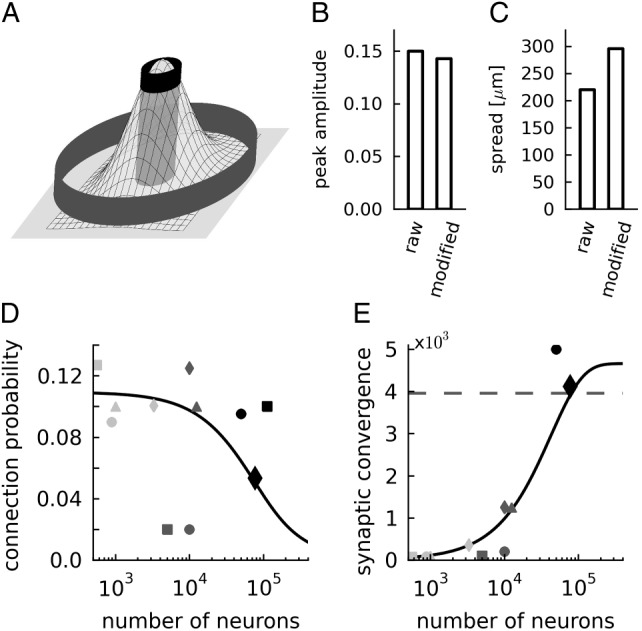
Lateral connectivity model. (A) Two-dimensional Gaussian with 2 cylinders indicating the lateral sampling of the anatomical (gray outer cylinder) and the physiological (black inner cylinder) experiments. (B) Estimated peak amplitude C0 and (C) lateral spread σ of the connectivity model based on mean connectivity of the anatomical and physiological raw and modified maps. (D) Average connection probability (black line, based on eq. (9)) and (E) average synaptic convergence (black line, average number of synaptic inputs per neuron derived from the connection probability and the number of neurons using eq. (1)) of the layered network model as a function of the network size expressed in number of neurons. The dashed horizontal line marks 85% of the maximal synaptic convergence in the local network. Black diamonds show the data used in our simulations, further markers indicate other published cortical network models: Haeusler and Maass (2007) (light gray square), Izhikevich (2006) (light gray triangle), Izhikevich et al. (2004) (light gray circle, embedded local network is defined by the area receiving connections from a single long-range axon), Lundqvist et al. (2006); Djurfeldt et al. (2008) (light gray diamond, local network represented by one hypercolumn), Vogels and Abbott (2005); Vogels et al. (2005) (dark gray circle), Sussillo et al. (2007) (dark gray square), Brunel (2000) (dark gray triangle), Kriener et al. (2008) (dark gray diamond), Kumar et al. (2008) (black circles), and Morrison et al. (2007) (black square).