
Figure 9.
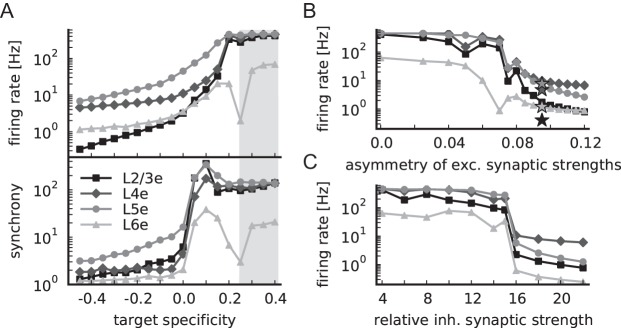
Relevance of target specificity for network stability. (A) Population firing rates (top panel) and synchrony (bottom panel), both in logarithmic representation, as a function of the target specificity of candidate projections L2/3e to L4, L2/3e to L6, L5e to L2/3, and L6e to L4, see Supplementary Table 3 for corresponding connection probabilities. A target specificity of zero reflects random connectivity; the gray-shaded area marks the range of target specificity of other interlayer connections (0.33 ± 0.08). (B) Population firing rates of the model with target specificity of candidate projections of +0.4 as a function of the asymmetry of excitatory to inhibitory and excitatory to excitatory synaptic strengths (defined as (wie − wee)/(wie + wee), with fixed mean excitatory synaptic strength). Stars indicate firing rates of the reference model with target specificity of candidate projections of −0.4. (C) As B, but as a function of the relative inhibitory synaptic strength. All markers as in Figure 8A.