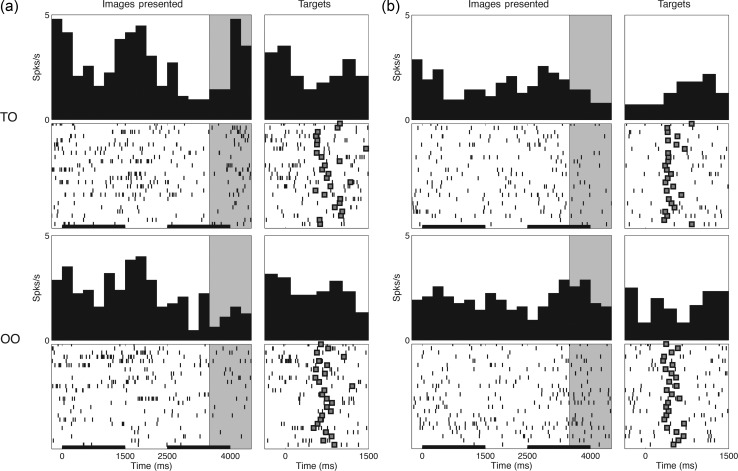
Figure 5.
Peristimulus time histograms and raster plots for 2 DLPFC neurons that represented differences in abstract rules. Neural activity for TO (upper panels) and OO trials (lower panels) is shown for (a) a neuron firing preferentially for TO trials as well as (b) a neuron firing preferentially for OO trials. Within each panel, activity is aligned to the presentation of the task images (left) and appearance of the red–green targets (right). The black horizontal scale bars indicate the image presentation period (1500 ms each), and the filled boxes indicate the times of joystick movement (target selection). The shaded regions indicate the second image delay period (see text), during which these neuron demonstrated differential firing on TO versus OO trials. Note: (a) P = 0.0020, and (b) P = 0.023; Mann–Whitney test.

