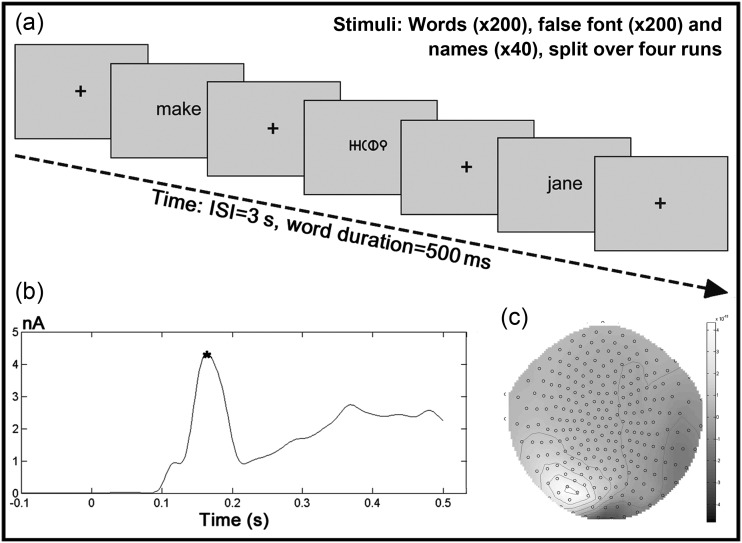
Figure 1.
Experimental procedure and analysis. (a) Schematic diagram of the experimental procedure, comprising word, false font, and name trials. (b) Example root mean squared plot across all sensors for the average of all word and false font trials for a sample participant. The asterisk indicates the M170 peak, which was identified in a semisupervised manner in each participant and used as the time-point for the VB-ECD source localization. (c) An example of the distribution of the sensor space data at the time of the M170 peak for the same participant.

