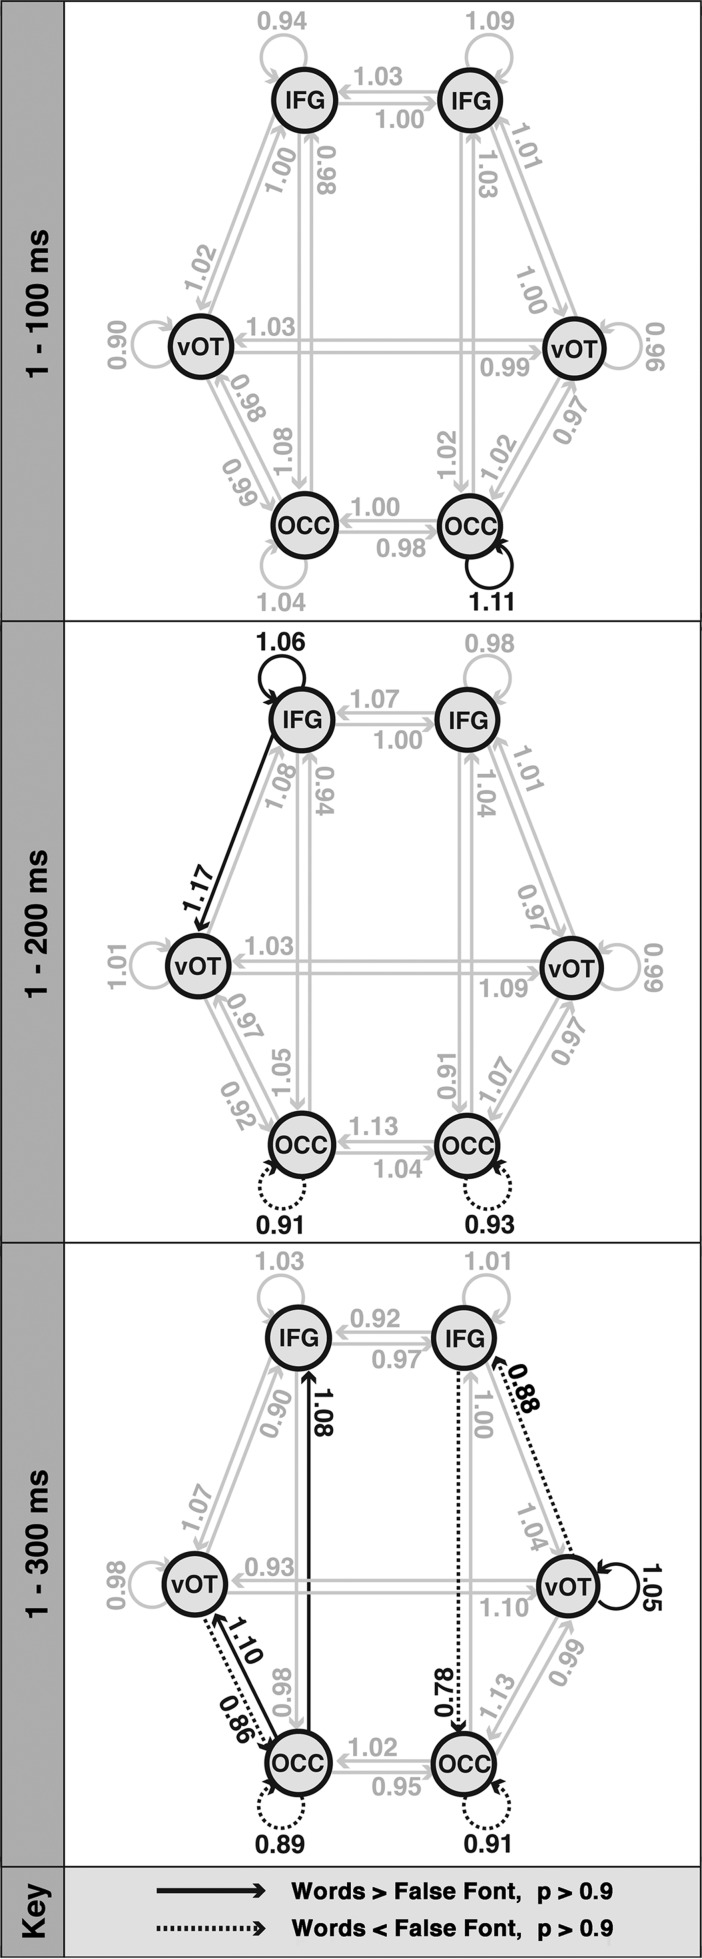
Figure 4.
The effects of stimulus type on connection strength. Results of the DCM analyses in 3 time-windows: 1–100, 1–200, and 1–300 ms. Arrows represent the modulatory effect of stimulus type on connection strengths. Values larger than one represent stronger connections for words relative to the false font baseline and were thresholded at P > 0.9 (highlighted with solid black lines). Values significantly smaller than one represent weaker connections for words versus baseline, again with a threshold of P > 0.9 (dotted black lines; N = 10).

