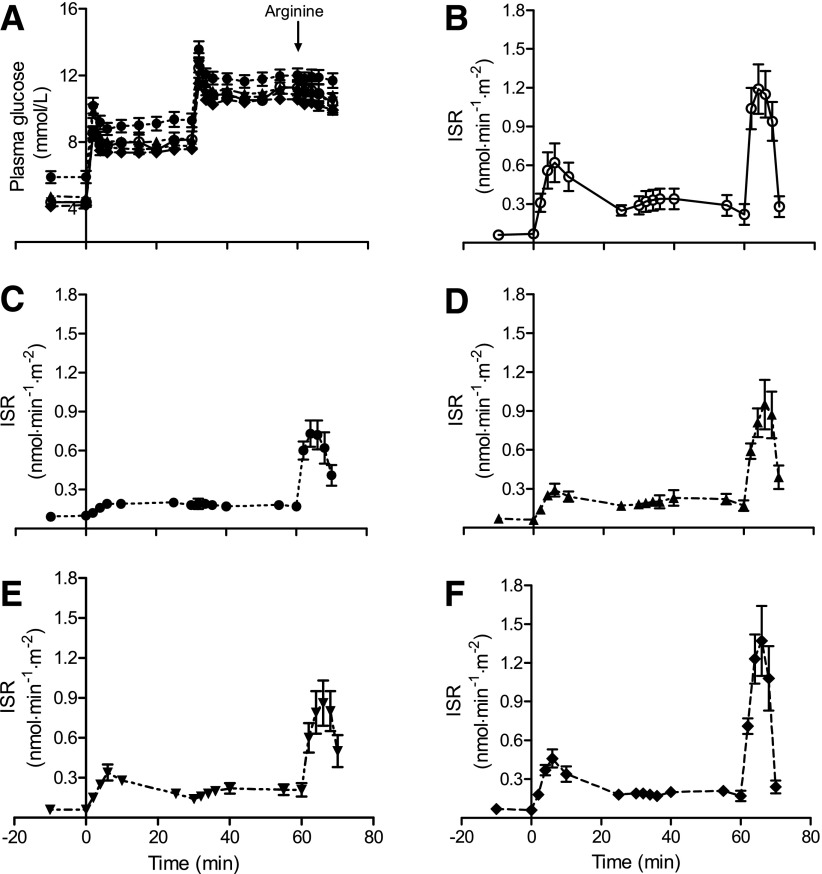
Figure 3.
Insulin secretion test data in control and diabetic subjects at each time point showing the complete normalization of first-phase and total insulin response after 8 weeks of dieting. A: Achieved plasma glucose levels in each group. B: Insulin section rates (ISR) in the nondiabetic control group. C: Diabetic group at baseline. D: Diabetic group at 1 week of diet. E: Diabetic group at 4 weeks. F: Diabetic group at 8 weeks. Data are shown as means ± SE. Reproduced with permission from Lim et al. (26).

