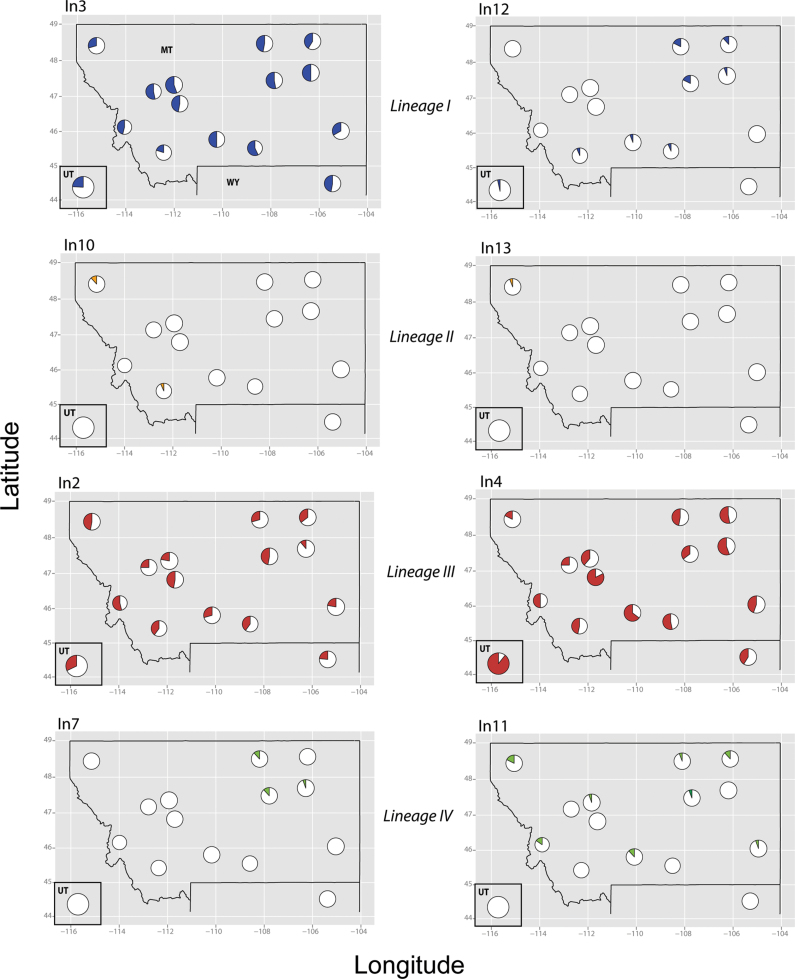
Figure 1.
Map of populations sampled and clustering solutions. Population (1-13, HLN) locations and clusters based on CrERV data are shown on a map of Montana (MT) and northern Wyoming (WY) (A), with colors corresponding to the CrERV clustering solution presented in part B. Utah (UT) is not shown on the map. Agglomerative hierarchical clustering dendograms are based on a Pearson’s uncorrelated distance matrix, calculated using CrERV insertion frequencies (B) and microsatellite allele frequencies (C) within localities.

