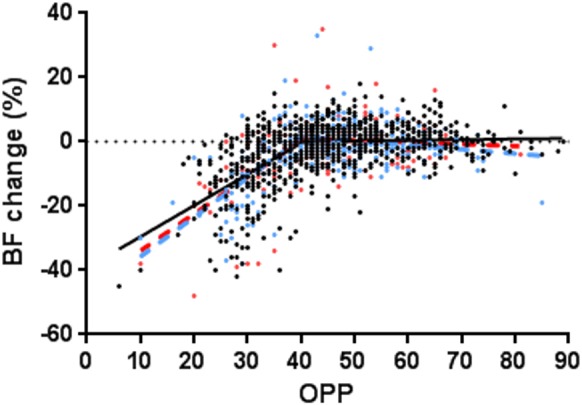
Figure 6.

The ONH autoregulation curves in early EG eyes (blue; n = 297 tests from 15 eyes), advanced EG eyes (red; n = 132 tests from 9 eyes), and all control eyes (black). The data from each group were fitted with a segmental linear regression model.
