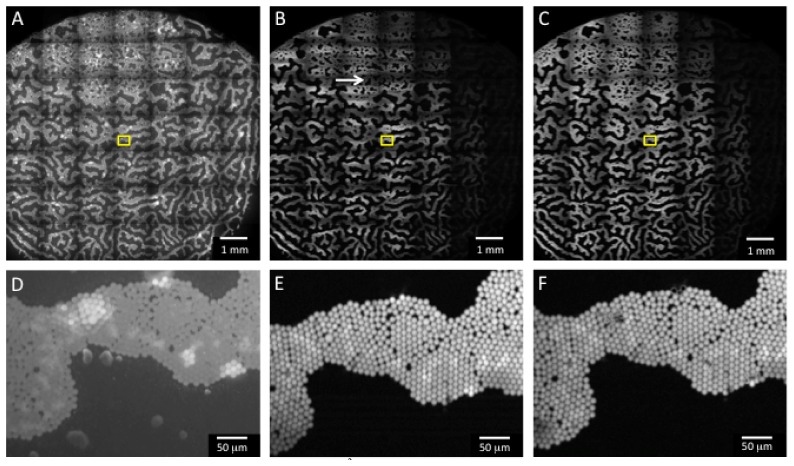
Fig. 3.
Images of Phantom B taken with the ROS3 system. A-C are mosaics of the phantom, corresponding to an area of 9.1 x 9.1 mm2 (scale bar 1 mm), and D-F are zooms corresponding to the boxed regions in A-C (scale bar 50 μm). A) Non-sectioned image taken with uniform illumination. B) SIM image at 12.4 ms integration time (SIM frame-rate = 26.9 Hz). The total image acquisition time was 1.82 seconds, and the stage translation time was 9.8 seconds (11.62 seconds total scan time). White arrow is aligned with the striping artifact due to inexact timing between the SLM display sequence and end of the camera exposure. C) SIM image at 100 ms integration time (SIM frame-rate = 3.33 Hz). The total image acquisition time was 14.7 seconds, and the stage translation time was 9.8 seconds (24.5 seconds total scan time).

