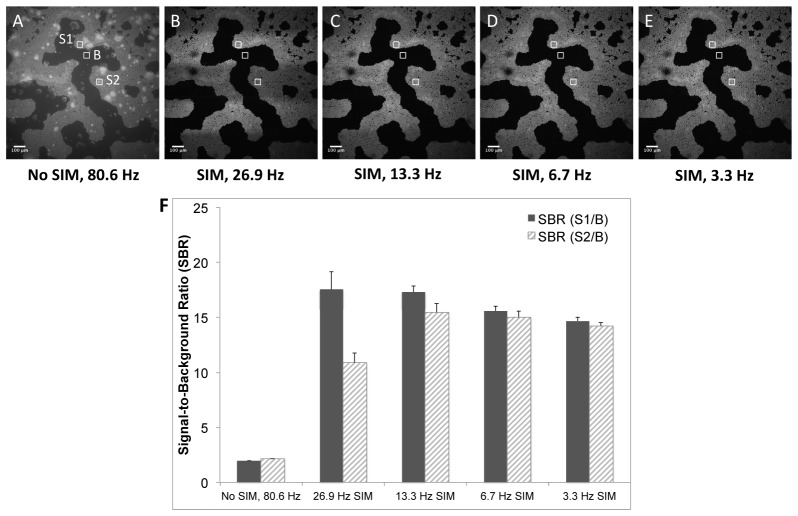
Fig. 4.
Single-frame (1.3 x 1.3 mm) images of Phantom B. A) Non-sectioned (standard wide-field) image at 80.6 Hz frame-rate. SIM-sectioned images at B) 26.9 Hz, C) 13.3 Hz, D) 6.7 Hz, and E) 3.3 Hz frame-rates. Scale bars = 100 μm. F) Average signal-to-background ratio (SBR) for each of the frame-rates calculated over 10 sequential images, computed using the ROI’s indicated in A. Error bars are ± one standard deviation. S1/B = SBR in artifact-free region, S2/B = SBR in region of horizontal banding artifact.

