
Fig. 4.
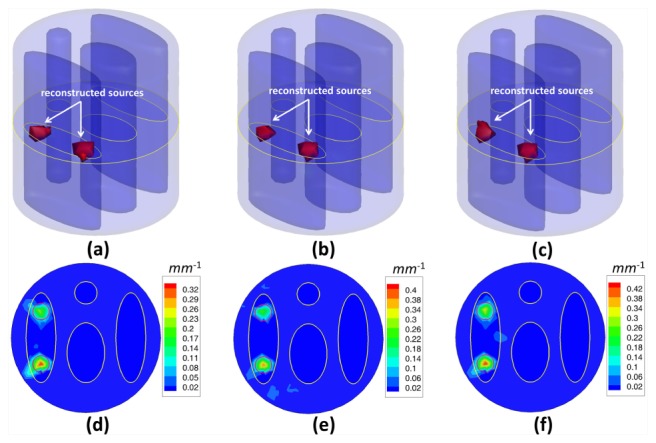
Fluorescent yield reconstruction results by the IS_L1 method (a, d), the StOMP method (b, e) and the proposed method (c, f) for the double spherical fluorescent sources and 12 measurement data sets corrupted by 5% Gaussian noise. The first row (a, b, c) shows the 3D views of the reconstruction results and the second row (d, e, f) shows the corresponding slice images in the z = 0 plane. The red circles in the slice images denote the real locations of the fluorescent sources.