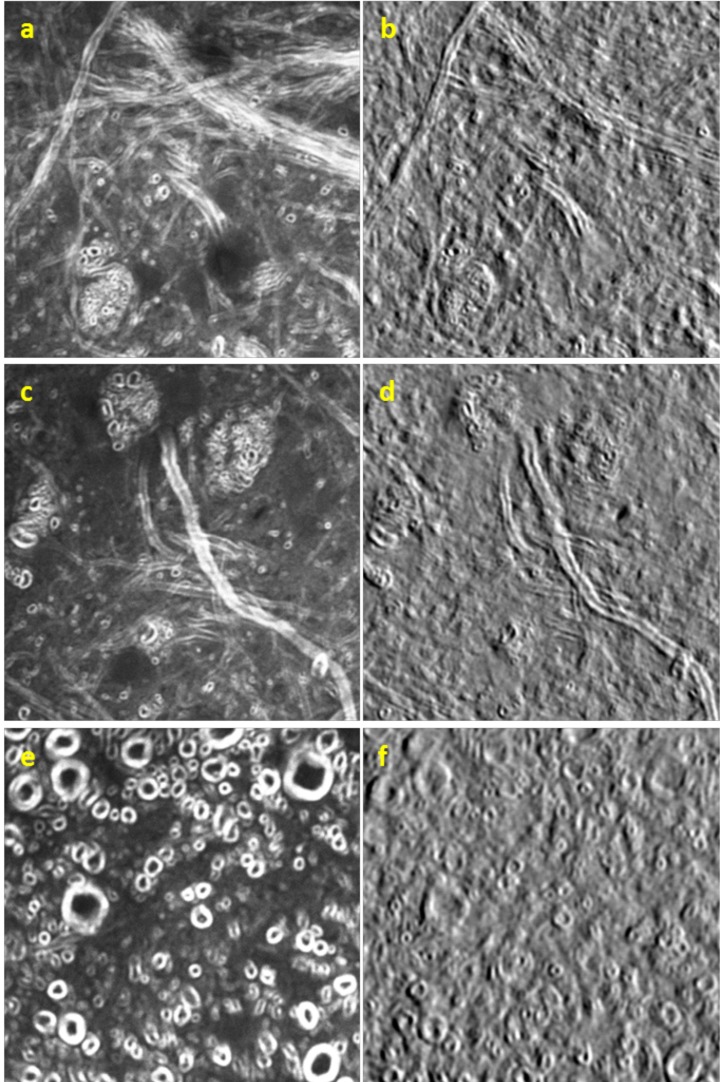
Fig. 3.
Simultaneous CARS (left) and sOBM (right) images of a cross-sectional cut of a mouse spinal cord from lumbar region. The CARS signal arose mostly from lipid-rich myelin sheaths surrounding nerve axons. Note correspondence between CARS and sOBM images. Focal depth was approximately 10 μm. Field of view was (a–d) 78 μm and (e,f) 55 μm.

