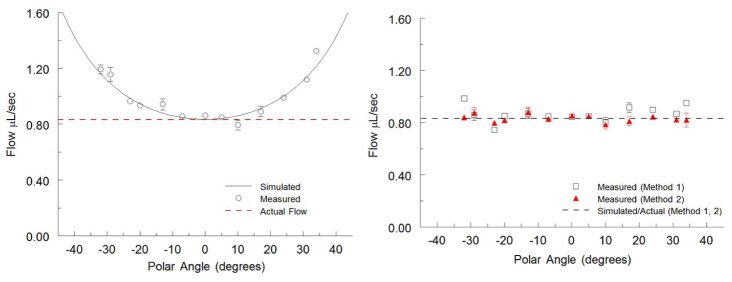
Fig. 3.

Simulated and measured flow rates in a capillary tube plotted against varying polar angles. A syringe pump perfused the capillary tube at a constant flow rate of 0.83uL/sec represented by the dotted line in both panels. (a) Flow rates calculated from the straightforward analysis utilizing Eq. (6) showing the increasing overestimation at larger polar angles. The results generated from the simulated data are represented by the solid black line. (b) Flow rates calculated using methods 1 and 2 showing unbiased flow measurement at all angles measured. The simulated data are identical to the constant flow rate line so they are both represented by a single black dotted line. All measured flow rates are represented as mean ± S.D. over 80 imaging frames.
