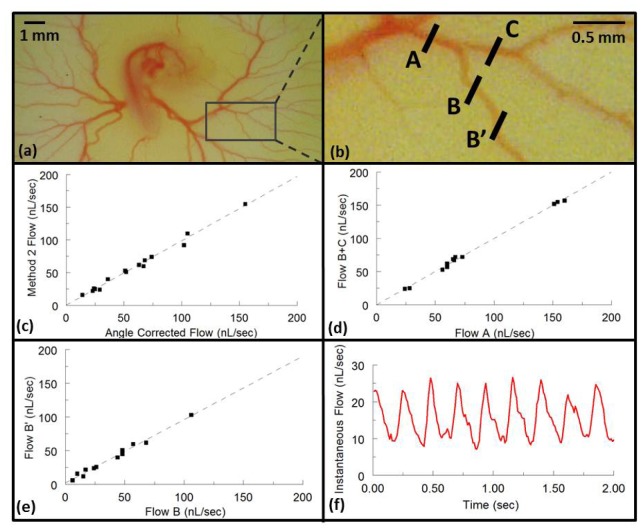
Fig. 5.
(a) A representative stage HH18 quail embryo in shell-less culture was removed from the incubator and photographed with a microscope (Dino-Lite, AnMo Electronics Corporation, Torrance, CA) for documentation purposes. (b) Enlarged image marked by a box in (a) of representative imaged vessels. B-scan OCT images were obtained and the resulting data processed to calculate flow using analysis method 2 and by correcting for the Doppler angle measured via 3-D structural volumes for the same cross section. The resulting time-averaged flows are plotted against each other in panel c. B-scan OCT images were also obtained at A, B, and C to measure the time-averaged absolute flow before and after bifurcations. The corresponding flows are shown in panel d. Finally, vessels were imaged at two different positions (B and B’) to confirm consistent time-averaged flow measurements at different vessel positions and orientations. The resulting flows are represented in panel e. (f) A representative pulsatile flow rate is plotted over 8 heart cycles.

