
Fig. 4.
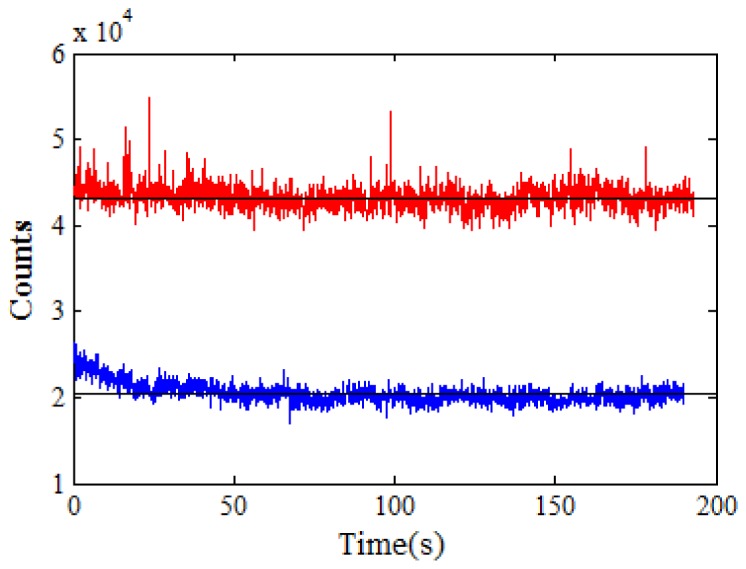
Background subtracted emission from the NV−center (blue trace) showing an approximately 2 fold increase in counts after being embedded in silk (red trace). The black lines represent the average counts for the corresponding count rates.
Official websites use .gov
A
.gov website belongs to an official
government organization in the United States.
Secure .gov websites use HTTPS
A lock (
) or https:// means you've safely
connected to the .gov website. Share sensitive
information only on official, secure websites.
Background subtracted emission from the NV−center (blue trace) showing an approximately 2 fold increase in counts after being embedded in silk (red trace). The black lines represent the average counts for the corresponding count rates.