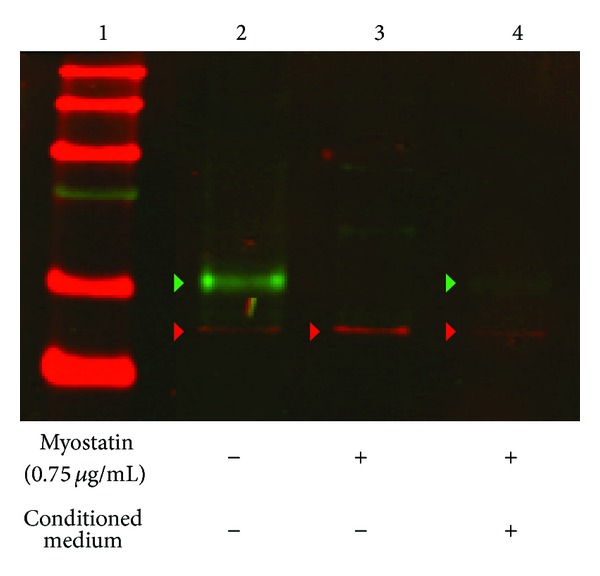
Figure 7.

Representative Western blot analysis of MyoD protein expression. Nontreated cells clearly showed an expression of MyoD protein (lane 2) whereas no MyoD protein was detected after incubation with myostatin (lane 3). After incubation with CM of ASCs a weak but significant expression of MyoD was detectable by Western blot analyses (lane 4). A total protein amount of 90 μg was loaded on each lane. Green arrow indicates the band of MyoD and red arrow indicates β-Actin as loading control (N = 3).
