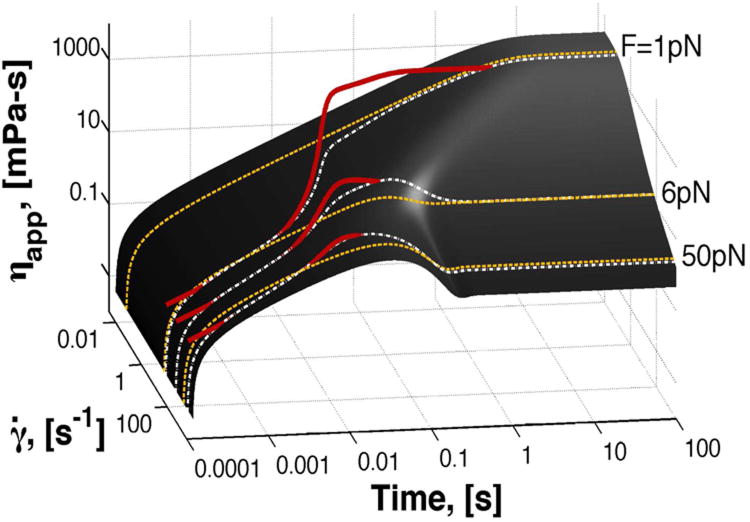
FIG. 7.
Surface of apparent viscosity, ηapp, versus time, obtained from solutions of the Rolie-Poly model with imposed constant shear rate, γ ˙(t). Three examples of CAP experiments are shown in yellow curves, which correspond to experiments with constant shear rate. Red curves correspond to Rolie-Poly simulations of magnetic bead trajectories with their surface projections shown as white dashed lines. Recall that the initial condition for the bead trajectories (red lines) is U(0) = FM/6πaηs, in our simulations ηs = 0.005 Pa-s and a = 0.5 microns.

