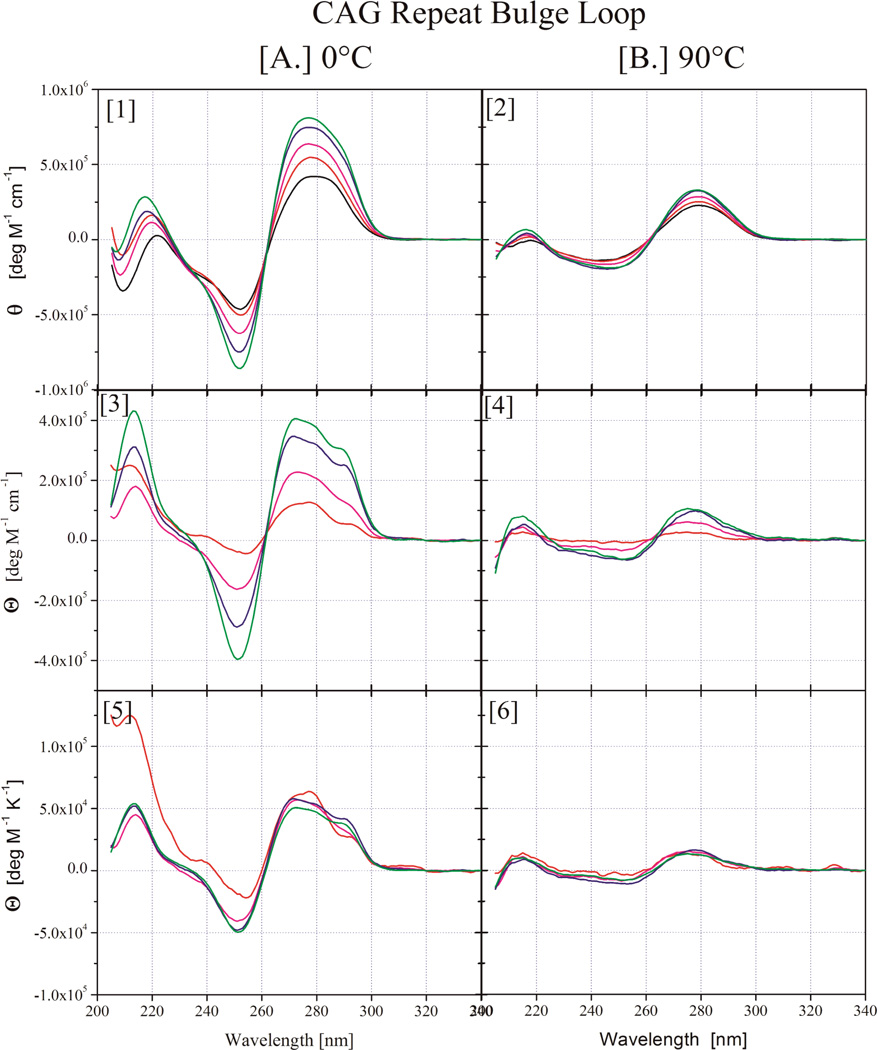
Figure 1.
CD spectra for Ω-DNA bulge loop structures with increasing number of CAG repeats. ((CAG)2 - red,(CAG)4 - purple, (CAG)6 - blue, (CAG)8 - green, the parent 22mer duplex lacking a bulge loop is shown in black). In panels 1 & 2 the measured experimental data are shown, whereas panels 3 & 4 show the residual spectra after subtraction of the parent duplex contribution and panels 5 & 6 show the normalized residual spectra after normalization by the number of repeats in the loop domain. The native state spectra at 0°C are grouped together in Column A, whereas the denatured state spectra at 90°C are displayed in Column B.

