
Fig. 2.
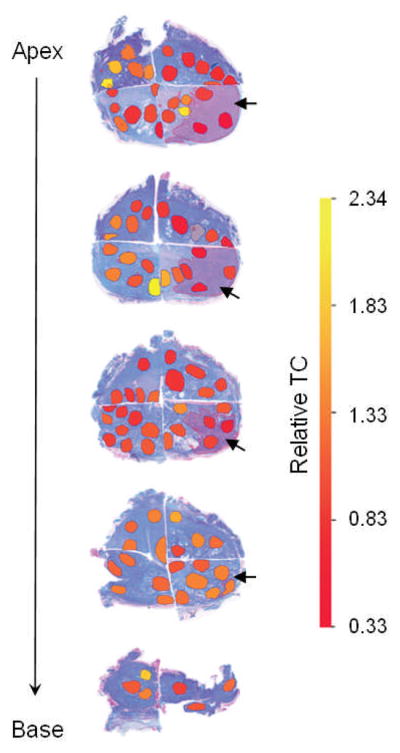
Organ-wide (from apex to base) spatial distribution of TC in transversal sections of a representative prostate affected by adenocarcinoma. The dark shaded areas represent cancerous tissues (indicated by thick arrows); the circumscribed areas represent excised tissues for TC analysis. Relative TC ratios are color coded with red designating low and yellow high TC as indicated by the heat map. Note: Outlier TC measurement (non-colored excision located in upper right quadrant of second section from top) was omitted.