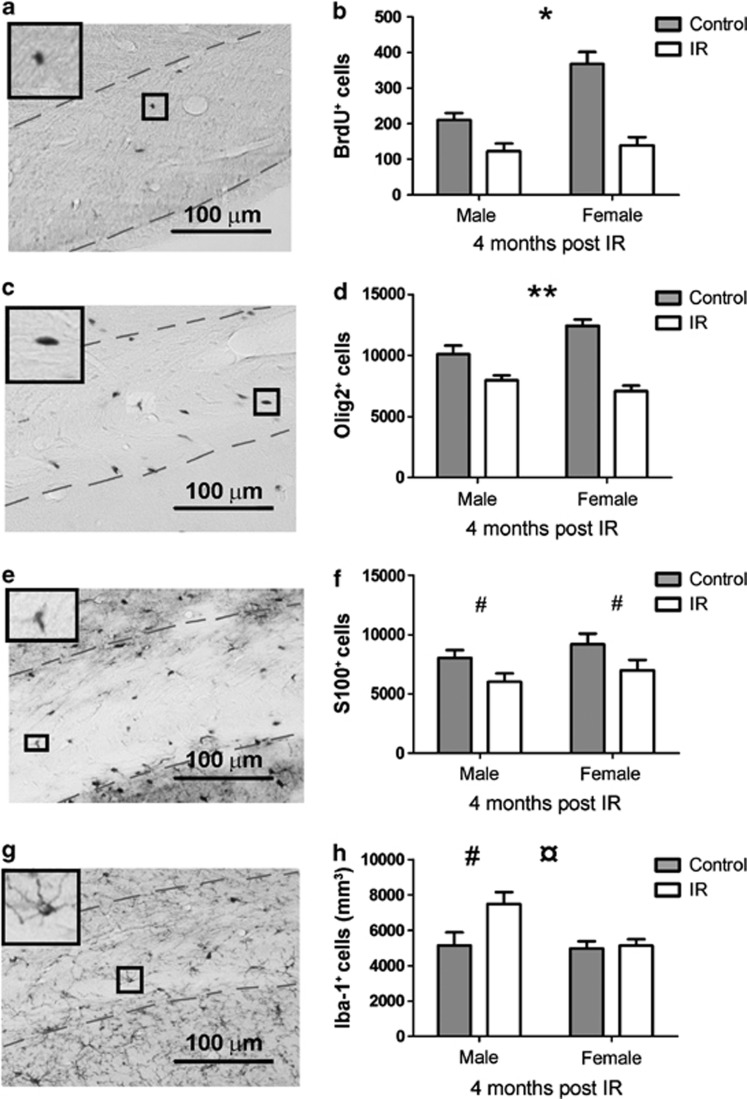
Figure 5.
The panels to the left show representative photographs of the different stainings ((a) BrdU+ cells, (c) Olig2+ cells, (e) S100+ cells and (g) Iba-1+ cells). The right panels show the quantifications of the different cell types ((b) BrdU+ cells, (d) Olig2+ cells, (f) S100+ cells and (h) Iba-1+ cells at 4 months post IR). All data shown as mean ±S.E.M. *P<0.05, **P<0.01 for interaction between sex and treatment, ¤P<0.05 for sex, #P<0.05 for treatment

