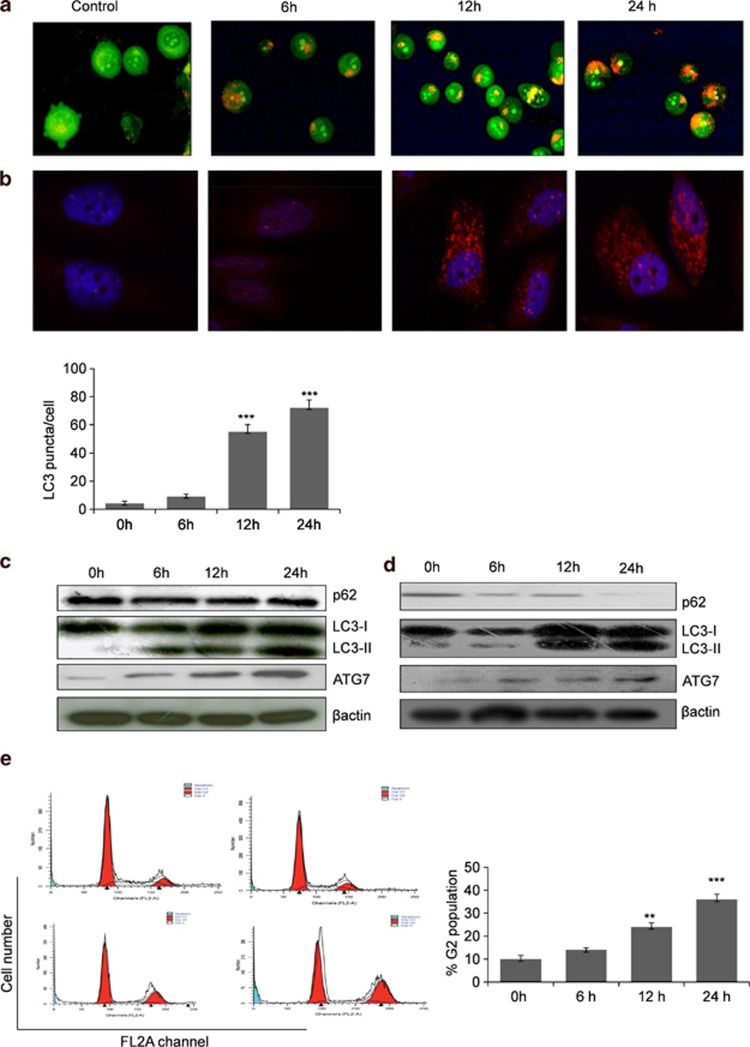
Figure 2.
Ery5 induces autophagy in PC-3 cells and HUVECs. (a) PC-3 cells were incubated with 10 μM of Ery5 for 6, 12 and 24 h. AO (1 μg/ml) was added 15 min before termination of the experiment; cells were collected, washed once with PBS and AO fluorescence was observed under fluorescence microscope. (b) Ery5-induced LC3 level in PC-3 cells. PC-3 cells were grown on cover slips and treated with 10 μM of Ery5 for 6, 12 and 24 h. The samples were processed for immunofluorescence as described in Materials and Methods. Autophagic puncta per cell were counted and are displayed in the form of bar diagram. Data are mean±S.D. of three similar experiments; statistical analysis was done by using the Bonferroni method and P-value<0.05 was considered to be significant with ***P<0.001. (c and d) Ery5 activates autophagy in PC-3 and HUVEC. PC-3 and HUVECs were seeded in 60 mm dishes and incubated with 10 μM of Ery5 for 6, 12 and 24 h. Cells were lysed with RIPA buffer, proteins were separated on SDS-PAGE and western blots for indicated proteins was done as described in Materials and Methods. (e) Ery5 induces G2 arrest in PC-3 cells. PC-3 cells were plated in six-well plate and incubated with 10 μM of Ery5 for indicated time periods. Cell cycle phase distribution was done as described in Materials and Methods. Data are mean±S.D. of three similar experiments; statistical analysis was done by using the Bonferroni method and P-value<0.05 was considered to be significant with **P<0.01 and ***P<0.001

