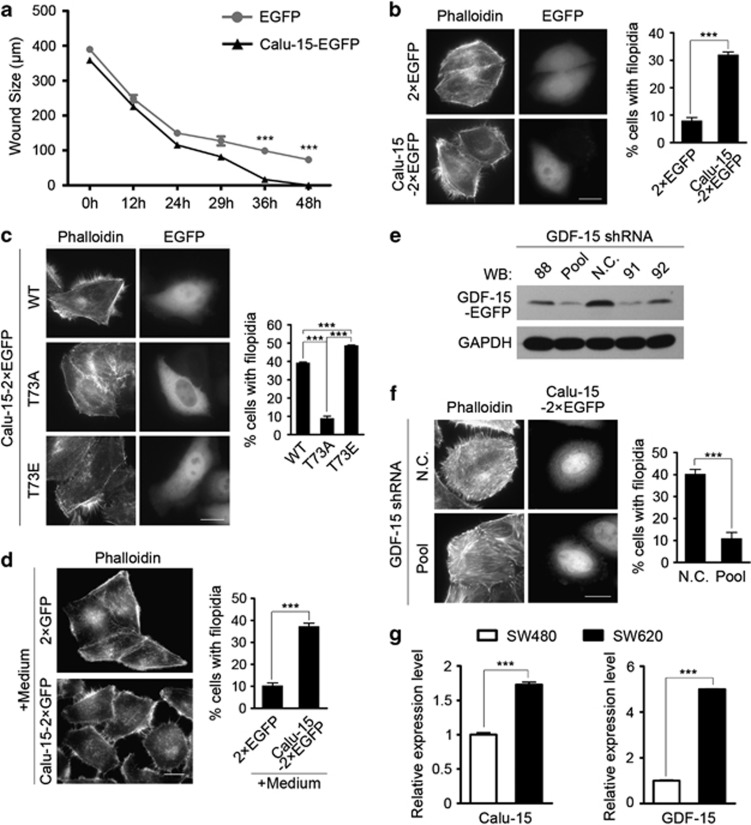
Figure 5.
Calumenin (Calu)-15 promotes cell migration and facilitates filopodia formation in a growth differentiation factor-15 (GDF-15)-dependent pathway. (a) Wound sizes of HeLa cells expressing Calu-15–EGFP or EGFP at the indicated time points (n=3). Data are mean±S.E.M.; ***P<0.001 (unpaired two-tailed Student's t-test). (b) HeLa cells transfected with Calu-15–2 × EGFP or 2 × EGFP were stained with Atto 565 phalloidin to show the localization and distribution of filamentous (F)-actin. Left panel, representative pictures. Bar, 10 μm. Right panel, the graph shows the percentage of cells with filopodia (n=3; >100 cells per experiment). Data are mean±S.E.M.; ***P<0.001 (unpaired two-tailed Student's t-test). (c) HeLa cells transfected with Calu-15–2 × EGFP wild type (WT), T73A, or T73E were stained with Atto 565 phalloidin. Left panel, representative pictures. Bar, 10 μm. Right panel, the graph shows the percentage of cells with filopodia (n=3; >100 cells per experiment). Data are mean±S.E.M.; ***P<0.001 (unpaired two-tailed Student's t-test). (d) Conditioned medium collected from HEK293T cells transfected with Calu-15–2 × EGFP or 2 × EGFP were added into the cultures of HeLa cells, and then the HeLa cells were stained with Atto 565 phalloidin. Left panel, representative pictures. Bar, 10 μm. Right panel, the graph shows the percentage of cells with filopodia (n=3; >100 cells per experiment). Data are mean±S.E.M.; ***P<0.001 (unpaired two-tailed Student's t-test). (e) At 48 h after GDF-15 shRNA transfection, the protein level of GDF-15–EGFP in HEK293T cells were examined by immunoblotting (western blotting (WB)). N.C., negative control; 88, 91, and 92 indicate GDF-15 shRNA with different target sequences; Pool, a mixture of GDF-15 shRNA 88, 91, and 92. (f) At 48 h after cotransfection with Calu-15–2 × EGFP and GDF-15 shRNA pool (Pool, lower panels) or N.C. shRNA (upper panels), HeLa cells were stained with Atto 565 phalloidin. Left panel, representative pictures. Bar, 10 μm. Right panel, the graph shows the percentage of cells with filopodia (n=3; >100 cells per experiment). Data are mean±S.E.M.; ***P<0.001 (unpaired two-tailed Student's t-test). (g) Quantitative real-time PCR analysis of the relative mRNA expression levels of Calu-15 and GDF-15 in SW480 and SW620 cancer cells (n=5). Data are mean±S.E.M.; ***P<0.001 (unpaired two-tailed Student's t-test). For b, c, d and f, to quantify the number of cells with filopodia, cells were scored positive when presenting at least 10 filopodia ≥4 μm in length

