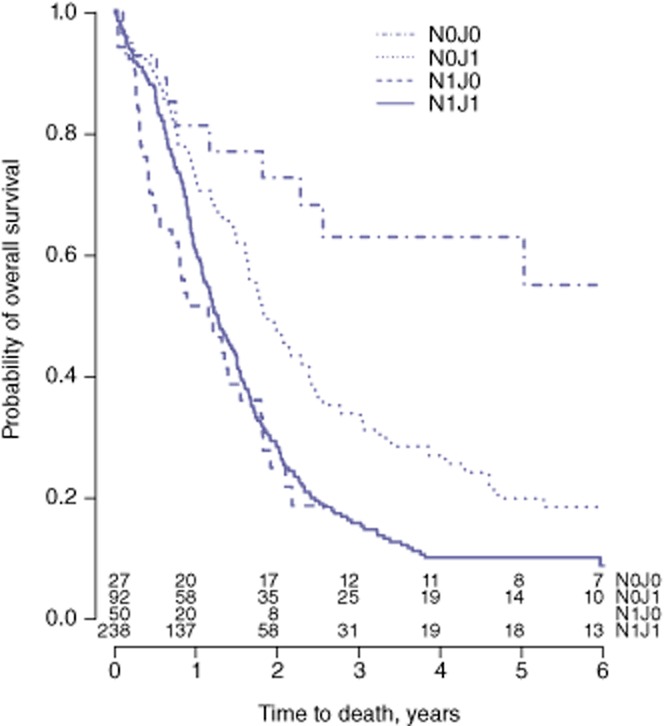
Figure 2.

Kaplan–Meier curves for overall survival in subgroups of patients categorized according to nodal (N) status and the presence or absence of jaundice (P < 0.001). N1, lymph node metastasis present; N0, lymph node metastasis absent; J1, jaundice present; J0, jaundice absent
